
The ROI of delivery, part 1 of 3. A three-part series built on the report The ROI of nShift, a practical guide to delivery economics. You are reading part 1. Next: part 2, does delivery management pay for itself, and part 3, how to measure delivery ROI.

In this blog: where delivery cost really hides, what it adds up to, and how to size the number for your own business.
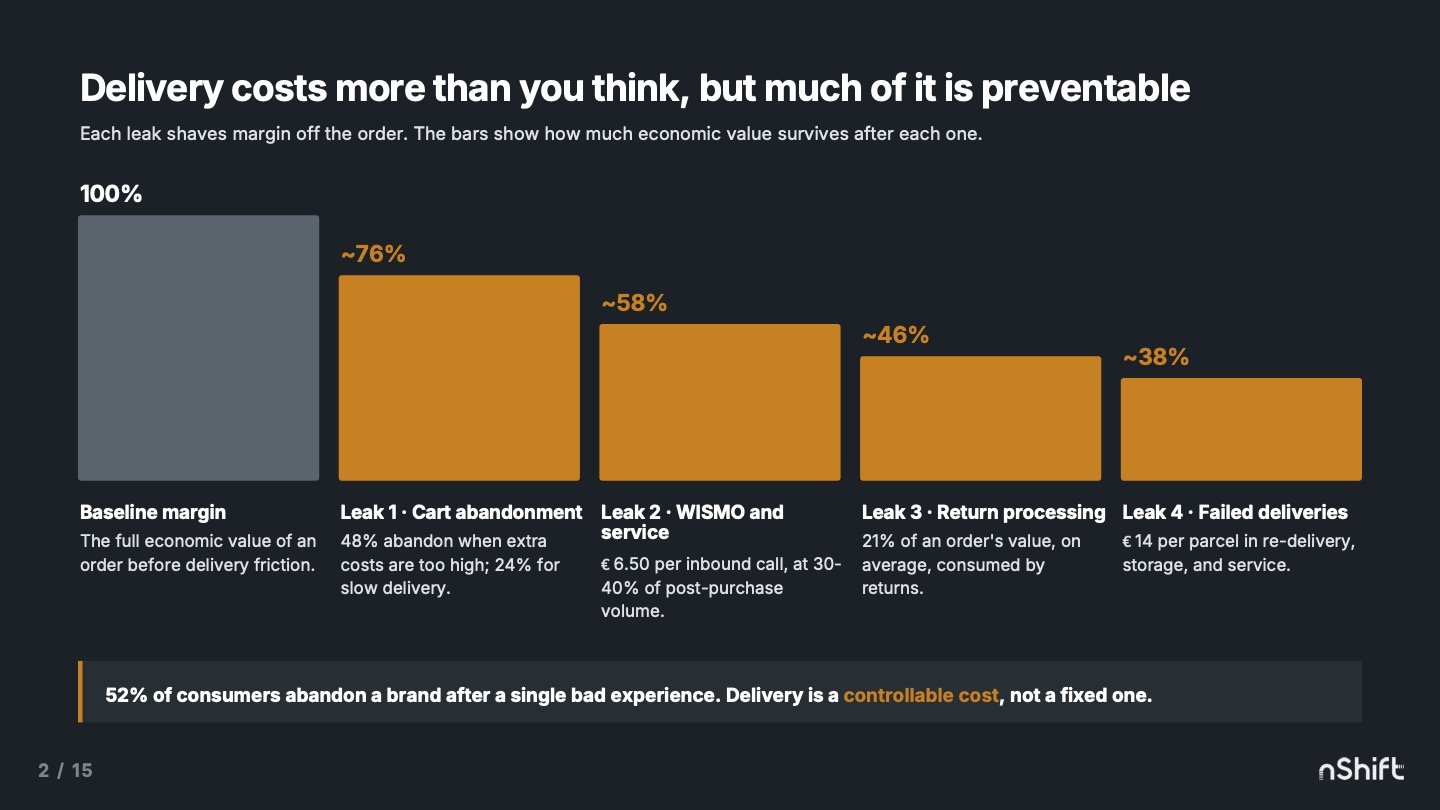
The true cost of ecommerce delivery reaches well beyond the shipping line on your P&L. The larger costs sit in customer support (the WISMO calls a poor delivery experience generates), warehouse labor on manual shipping, return processing, and the checkouts that abandon over delivery. Most of it is recoverable once you measure it and run delivery on one platform.
Open the P&L and delivery looks like one number: the shipping line. Carrier invoices, fuel surcharges, the occasional rate hike. Finance watches it, procurement negotiates it, and most cost-control effort goes there because that is where the cost appears to live.
The larger number is spread across the support desk, the warehouse floor, the returns bay, and the orders that abandoned at checkout and never became revenue at all. None of it carries a label that says “delivery,” which is why it goes unmanaged. You can only control a cost once you can see it, so the useful exercise is to follow the money out of the building and add up where it goes. This is the hidden cost of ecommerce delivery, and most of it is recoverable.
Why delivery cost hides from the P&L
Accounting groups cost by department, not by customer journey. The call a shopper makes to ask where their parcel is gets booked as a customer-service cost. The 90 seconds a warehouse worker spends choosing a carrier and printing a label is booked as warehouse labor. A refund on a parcel that arrived late is booked against returns. Each one traces back to the same delivery experience, but the ledger files them in different places, so no single owner ever sees the total.
That total has a name worth borrowing from procurement: cost to serve. It is what one order costs you to fulfill, all in, after the shipping line. nShift delivery management runs delivery as one platform across checkout, shipping, tracking, returns, and emissions, connecting 1,000+ carriers from a single integration, which is what lets you see and control these costs in one place. Four drivers account for most of the gap.
The support line: WISMO is a delivery cost in a service-desk badge
“Where is my order?” tickets are the clearest example of a delivery cost filed under the wrong heading. WISMO inquiries make up 30 to 40% of post-purchase support volume, and the average inbound call to a European contact center costs GBP 5.58 (ContactBabel, 2024). Every one of those calls exists because the customer could not see their parcel, which is a delivery-visibility problem paid for out of the support budget.
Give shoppers a branded tracking page and proactive updates and the calls stop arriving. Swedish online pharmacy Apotea saw a 27% reduction in customer service calls after taking control of the post-purchase experience with nShift Track. The calls that never come in are headcount you do not have to add as you grow.
“Customers do not feel abandoned after pressing the ‘Buy’ button. They feel like they have closer contact with us because statuses are sent the entire time.”
Pär Svärdson, Managing Director, Apotea
The warehouse line: manual booking is labor you pay for twice
Every minute a warehouse worker spends selecting a carrier, printing a label, or fixing a misprint is a minute they are not picking, packing, or shipping the next order. At EUR 34.90 per hour on the EU average and EUR 55.10 in the Nordics, climbing 4.1% year on year (Eurostat, 2025), that manual time is a real and rising line item, just one booked as warehouse cost rather than delivery cost.
Automation collapses it. Danish distributor DTK Group combined the shipping label and packing slip into a single printout with nShift Ship and cut processing from two and a half minutes per order to 15 seconds, saving 35 printing hours a day. Norwegian distributor Wittusen & Jensen automated its delivery-note printing and saves the equivalent of an entire annual salary, plus the paper, toner, and printer maintenance that went with it. That labor moves to work that ships more orders.
27%
fewer customer service calls
Apotea, after taking control of post-purchase tracking
35 hrs/day
of printing time saved
DTK Group, label and packing slip on one printout
1 salary
saved every year
Wittusen & Jensen, automated delivery-note printing
The returns line: 21% of order value, waiting to be recovered
Processing a single return costs 21% of the order’s value on average (NRF and Happy Returns, 2024), and European return rates run 20 to 25%. Treated as a cost to absorb, that money is gone. Treated as a process to run well, most of it comes back.
The recovery has two parts. First, faster handling: when staff register an incoming return in a few clicks and stock updates in real time, the per-return labor cost drops and accuracy rises. Norwegian outdoor retailer Friluftsmagasinet did just that, and its customer-service team now fields far fewer calls about how to track and return a parcel. Second, the refund-versus-exchange split: a full refund loses the 21% processing cost on top of the reversed revenue, while an exchange costs only the processing and keeps the sale. Steer returns toward exchanges and in-store drop-off with nShift Returns and you hold onto order value you would otherwise hand back.
Regulation is pushing the same way. From July 2026, large companies operating in the EU can no longer destroy unsold or returned clothing, footwear, and accessories, which rewards returns processes that resell or exchange rather than write off.
The conversion line: the cost of the sale you never made
This is the largest hidden cost and the hardest to see, because it never reaches the P&L at all. It is revenue that did not happen. About 48% of online shoppers abandon their cart when extra costs like shipping and fees run too high, and another 24% leave because delivery is too slow (Baymard Institute, 2024). Both are delivery-choice problems, and they surface as a flat conversion rate.
The math is unforgiving in the other direction too. For a retailer with 500,000 monthly sessions at a 2.5% conversion rate, a single percentage-point lift means 5,000 extra orders a month. Offer the right delivery options at the point of purchase, home, pickup point, locker, time slot, priced and presented to suit the shopper, and conversion moves. Delivery speed and choice now outweigh loyalty-program membership when people decide where to shop, so the cost of getting checkout wrong compounds with every session.
More accurate delivery promises help on the same front. nShift ETA, an AI-powered arrival estimate launched in 2026, combines real-time carrier signals with historic shipment data so checkout can show a realistic date, which keeps some of the shoppers who would otherwise leave over a slow or uncertain delivery.
Add it up: the real cost to serve
Modeled across a midsize European retailer (500,000 monthly sessions, EUR 85 average order value, 150,000 annual shipments, 20% return rate), the recoverable value of these four drivers runs to roughly EUR 2 million a year in conservative assumptions, with the conversion lever alone worth around EUR 1.86 million. See the full breakdown in The ROI of nShift, which compiles verified results from 38 named European retailers alongside third-party benchmarks from Baymard, ContactBabel, NRF, Eurostat, Capgemini, and PwC, and use it to benchmark your own numbers.
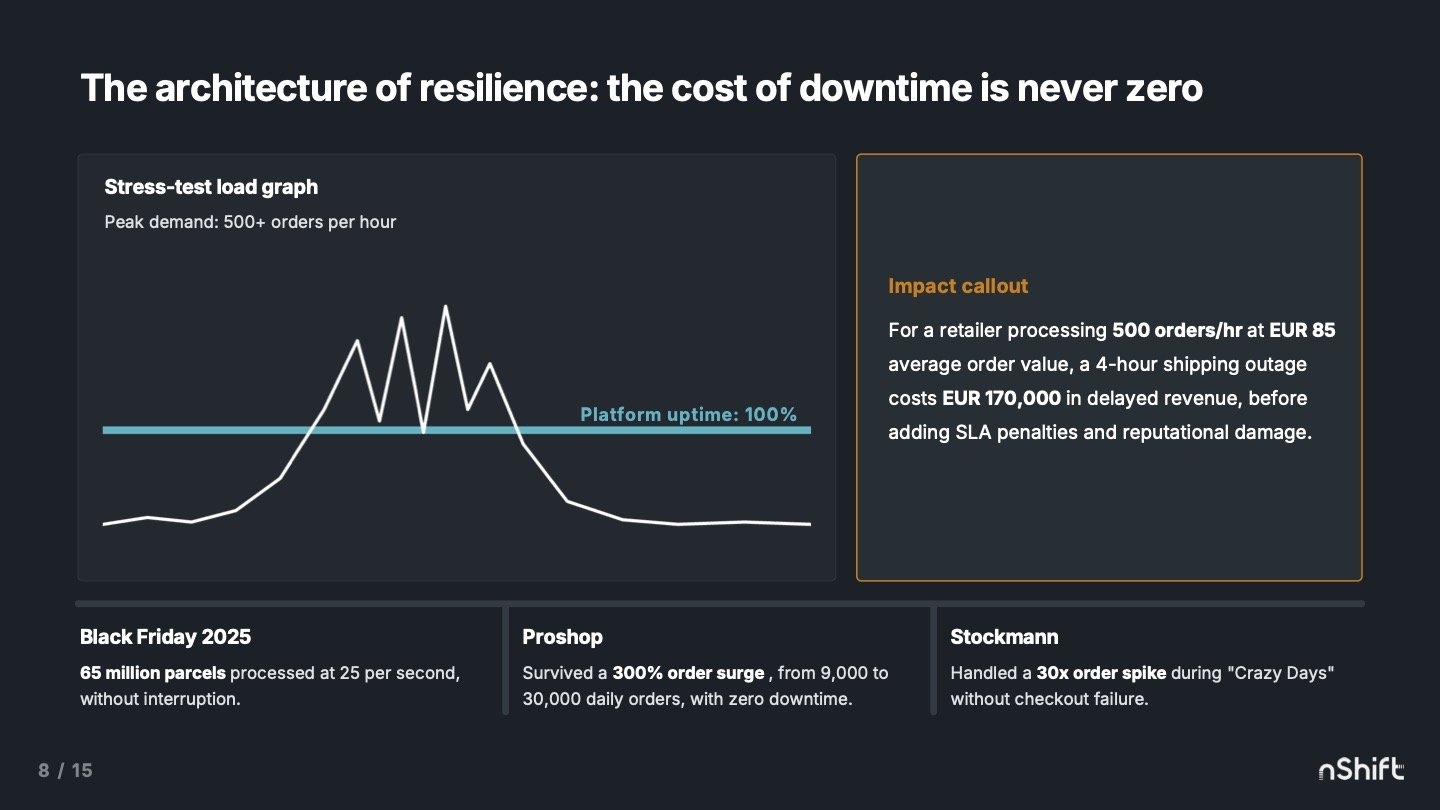
One cost rarely makes the model: downtime. For a retailer processing 500 orders an hour at EUR 85 average order value, a four-hour shipping outage means roughly EUR 170,000 in delayed revenue, before SLA penalties or reputational fallout, which is why platform reliability belongs in the same conversation as the four leaks above.
The number to run for your own business is smaller and more specific: your current WISMO volume times GBP 5.58, your manual minutes per shipment times your loaded warehouse rate, your return rate times 21% of your average order value, your abandonment rate against your traffic. Run those four and you have the cost to serve that the shipping line was hiding, the figure that better delivery management sets out to give back.
Seeing the leak is step one. Part 2 of this series shows why fixing it compounds rather than adds, and Part 3 gives you the baseline-first method to prove the number before you spend anything.
Read the full model: The ROI of nShift · Book a demo