This article is part of our “Scale your ecommerce operation without limits” series, where we break down five practical strategies for building resilient, scalable delivery operations.
- Diversify to deliver – eliminating carrier bottlenecks for scalable shipping
- Automate for resilience – real-time delivery automation to eliminate manual strain
- Optimize with data – using delivery analytics for smarter shipping decisions (this article)
- Orchestrate without overwhelming – simplifying multi-option delivery experience
- Govern for growth – turning delivery operations into a scalable, repeatable machine
Prefer the full story in one place? Download the guide: Scale your ecommerce operation without limits
In e-commerce logistics, knowledge is power. Every package that ships generates a trail of data: transit times, delivery success or failure, shipping costs, customer feedback, tracking events, and more.
Optimizing with data means capturing all those data points, analyzing them, and using the insights to continually improve your delivery operation. This strategy turns shipping from a “set and forget” back-office function into a data-driven practice of ongoing refinement.
And the payoff is huge: lower costs, better carrier performance, and a smoother experience for your customers.
What is shipping analytics?
Shipping analytics is the practice of collecting the data every shipment produces (booking details, carrier scan events, delivery confirmations, exception codes and invoice lines) and turning it into metrics that inform decisions: which carrier to use for a lane, what delivery date to promise at checkout, and which invoice lines to challenge. None of this data is new. The raw material already exists in your shipping system, in each carrier portal and in the invoices finance pays. The goal is to bring those three sources into one record per shipment, with the same status definitions for every carrier, so that comparisons across carriers mean something.
This article uses delivery analytics and shipping analytics for the same thing: the outbound flow from booking to doorstep, plus the invoice that follows it. A spreadsheet can handle that work while the carrier list is short. It rarely stays that simple. Definitions start to drift when you add a second warehouse, a new carrier or a different service level. That is usually when the analysis moves into the shipping platform or transport management system that already holds the shipment record.
Start with unified visibility
The first step is consolidating your delivery data in one place.
If you’re using multiple carriers, it’s vital to have a single dashboard that shows all shipments across all carriers. This unified view allows apples-to-apples comparisons. You can monitor key performance indicators like on-time delivery rate per carrier, average transit duration by service level, percentage of shipments hitting their promised delivery date, and the frequency of customer inquiries (like “Where is my order?” calls).
Many retailers are surprised by what they discover – perhaps Carrier X is on-time 98% of the time while Carrier Y is only 85%, or one shipping service has far more lost-package claims than others. Armed with these insights, you can make informed decisions (e.g., favor Carrier X for critical shipments, or discontinue that problematic service).
Drive cost efficiency with data
Delivery analytics often reveal hidden cost-saving opportunities.
For instance, by analyzing weight-break data, you might find that packages just over 2kg incur a sharp rate increase, prompting you to adjust packaging or split shipments to stay in a lower bracket.
Or you might spot that two-day shipments often arrive overnight, indicating you could switch to a cheaper service without impacting customers. One nShift client realized they were paying premium for express air service to a zone that ground service reached just as quickly; switching saved them thousands with no service downgrade.
Additionally, when you compare carrier performance side by side using real metrics, you gain leverage in negotiations. If Carrier A is consistently 10% more expensive than Carrier B for the same delivery times, you can ask Carrier A for better rates or shift volume to Carrier B. Retailers using a multi-carrier approach report that having concrete performance data lets them negotiate better contracts and identify the best options for each route.
Improve carrier accountability and service quality
Data turns anecdotal issues into quantifiable trends. Instead of suspecting that “Carrier Z is often late,” you can pull a report that shows Carrier Z met its 2-day delivery promise only 78% of the time last month. With that evidence, you can push for service credits or operational improvements.
Some nShift customers set up automated alerts – for example, if a carrier’s on-time rate falls below 90% in a week, it flags the team to investigate or temporarily reroute shipments. This ensures small issues don’t snowball into big problems. Over time, holding carriers to data-backed KPIs leads to across-the-board improvements (since carriers know you’re measuring their performance closely).
Data can also guide you in optimizing your delivery promise to customers. By examining historical delivery times, you can set realistic yet competitive expectations. Say your standard shipping is quoted as 5-7 days, but data shows 95% of those orders actually arrive in 4 days – you have room to tighten the quoted window, which could boost conversion without changing anything operationally. Conversely, if data shows a particular route frequently takes longer than expected, you might proactively adjust the promise to avoid disappointing customers.
Enhance customer experience with insights
Analytics isn’t just inward-facing; it directly benefits your buyers too.
Monitoring metrics like WISMO (Where Is My Order) inquiry rates and delivery-related complaints helps you identify friction points in the customer journey. For example, if you notice a spike in WISMO calls for orders shipped via Carrier Y, perhaps that carrier’s tracking updates aren’t sufficient. You could respond by providing more proactive notifications or even switching to a carrier with better tracking.
It’s known that 84% of customers value the ability to track their orders, so using data to ensure you’re meeting that need will improve satisfaction. One apparel retailer, ICIW, discovered through data analysis that a significant share of support tickets were coming from customers asking about order status. By implementing unified, branded tracking and automated updates, they cut WISMO-related inquiries by 50%, freeing up their support team and keeping customers happier.
You can also analyze delivery feedback or ratings (if you collect post-delivery surveys or NPS scores tied to fulfillment). This can surface trends like “customers in region X are unhappy with long delivery times” – which you could address by using a closer fulfillment center or a faster local carrier. Or you might find that offering a small delivery rebate or coupon after a late delivery boosts retention, quantifiably reducing the chance of losing a customer due to one mistake. In other words, data helps transform negative experiences into actionable improvements.
What shipping analytics software should report
A shipping analytics report is useful when it can settle a question in the meeting where it comes up: with a carrier about a missed SLA, with finance about an invoice, or with the ecommerce team about the delivery promise shown at checkout. Every report that does that work breaks down by carrier, lane and service. A network average hides the pattern that matters.
Performance by carrier, lane and service. On-time delivery is usually the first metric in a carrier review. But a single figure for the whole network tells you very little. Split it by carrier, service level, lane, destination region and period, then put it next to the exception rate (failed attempts, held parcels, misroutes, address problems and returns to sender) and the first-attempt delivery rate. A parcel that arrives on the second attempt can still count as on time, even though it has already cost you a redelivery and a customer service contact.
Cost per shipment. Tracking spend by carrier, service and lane over time shows where you are paying for a premium service on a lane where a cheaper option delivers just as quickly. It also gives procurement the evidence for the next rate negotiation. Without that baseline, the comparison is noise. The rate cards and surcharge logic need an owner who keeps them current.
Invoice deviation. The report compares the freight rate your system calculated for each shipment with the amount the carrier billed, flags every mismatch and exports the verified discrepancies so finance can reconcile them with the carrier. Published freight audit benchmarks put recoverable overcharges at 3 to 7% of freight spend. The invoice lines most often missed in manual spot checks are accessorial charges and dimensional weight adjustments.
On-time delivery against the customer promise. Meeting the carrier's SLA and meeting the date the customer saw at checkout are two different measures. The report needs both. Transit-time accuracy compares the actual delivery date with the promised date, lane by lane. This shows when a carrier meets its three-day SLA but misses the next-day delivery promise on a particular route. Status quality belongs here too: the share of shipments with confirmed pickup, in-transit and delivery events. Some carriers send fifteen events per shipment and others send two. That difference shows up on your tracking page and in your support queue.
On nShift's multi-carrier shipping and delivery experience platform, the nShift Track Carrier Performance Report measures delivery performance against carrier-specific SLAs, with filters for carrier, product and date range. Its invoice control compares the calculated freight rate with the billed amount and exports the deviations for reconciliation. For nShift TMS customers, Qlik Sense dashboards in the Report module cover cost, emissions, carrier performance and delivery accuracy, including spend trends by carrier, route and period.
Each report needs consistent definitions for the metrics above. For a breakdown of each metric and the data needed to set up the reports (carrier return data, SLA definitions by carrier, service and lane, and invoice data), see the carrier performance measurement page.
Tools and practices
To get the most out of delivery analytics, establish a regular cadence for reviewing data – say, a weekly operations meeting to go over dashboard metrics and a monthly deep-dive into trends.
In these meetings, ask the critical questions: Where are we seeing delays or higher costs? What’s driving those issues? What can we change? In many cases the answers will lead to tweaks in your carrier mix (strategy #1), process changes or automations (strategy #2), or adjustments to customer communication (strategy #4).
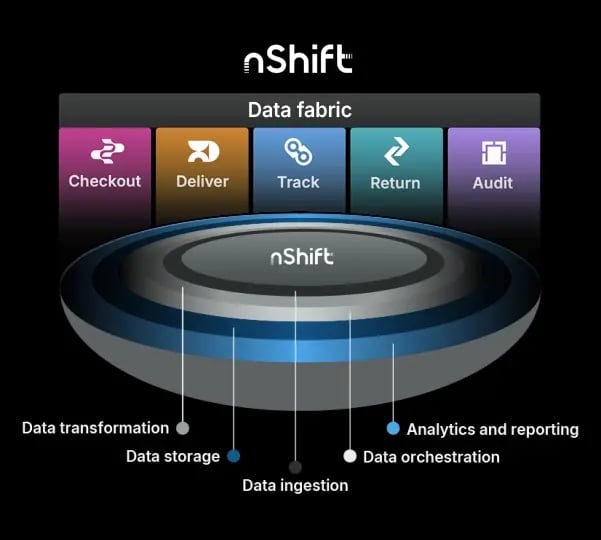
Modern delivery management platforms often include robust analytics modules (nShift’s “Data” features, for instance, aggregate all your shipping data and even use AI to spot anomalies). If your platform doesn’t, exporting data to a business intelligence tool or spreadsheet for analysis is a workable alternative – it’s a bit more manual, but the insights are worth it.
Data closes the loop on your scalable delivery strategy. It tells you what’s working well and what isn’t, so you can continuously refine your approach. The most successful e-commerce operations treat delivery metrics as core business metrics, right alongside sales and marketing data. By doing so, you turn delivery from a cost center into a source of ongoing value – improving efficiency, cutting costs, and keeping customers coming back with reliable, transparent service.
If you’d like to go deeper or share this framework with your team, explore the rest of the “Scale your ecommerce operation without limits” series:
- Diversify to deliver
- Automate for resilience
- Optimize with data
- Orchestrate without overwhelming
- Govern for growth
Ready to put it all into practice? Get the full guide: Scale your ecommerce operation without limits

Author
Thomas Bailey
Product Innovation Lead, nShift
Thomas plays a key role in shaping how new features and platform improvements deliver real value to customers. With a background spanning product, tech, and go-to-market strategy, he brings a pragmatic view of what innovation looks like in practice and how to make delivery experiences work harder for your business.