The second of ten deep-dives in our 2026 delivery trends mid-year check-in: when a control tower stops being a dashboard and starts changing what happens next. Read our analysis below.
Our 2026 trends report grouped predictive analytics, control towers, and digital twins together as the move from backward-looking reports to forward-looking decision systems. Six months on, that shift is real but uneven, and the mid-year data points to one practical distinction. Seeing a shipment slip is common now. Acting on it in time, by rerouting the volume, warning the customer, and holding the promise before the delay reaches the doorstep, is far less so. Closing that gap, between seeing a problem and doing something about it in time, is what a control tower is for.
What we said in early 2026:
Forecasting, control towers, and end-to-end digital twins are shifting logistics away from monthly hindsight toward continuous sensing and response.

Early adopters of digital twins report 20 to 30% better forecast accuracy and up to 80% reductions in delays and downtime when they simulate network decisions before execution. In European multi-node, cross-border networks, this becomes a core capability rather than a nice-to-have.
What a supply chain control tower is
A supply chain control tower is a connected operating view that pulls live data from carriers, warehouses, transport systems, and customer service into one place, adds analytics to anticipate problems, and connects back into the workflows where people act on them. In 2026, the useful ones are judged on what they set in motion: the alert that reaches the right planner, the reroute that clears before the cut-off, the message that reaches the customer before they chase.
Plenty of teams already run carrier tracking and a BI dashboard, and reasonably ask what a control tower adds. Tracking and BI report what happened and what is happening. The control-tower question is what to do in the next hour, and whether the system can do it, which a tracking page and a weekly export cannot.
Control tower, digital twin, and visibility software
These three terms get used interchangeably, though they describe different things.
-
Supply chain visibility software shows status: where shipments are, which are late, how carriers are performing. Most teams already run some form of it. It is necessary without being sufficient, because a status feed reports the situation without deciding anything.
-
A control tower adds a decision layer on top: analytics that flag which shipments will slip, and the workflow to act on them, rerouting volume, triggering a customer message, or suppressing a delivery promise at checkout.
-
A digital twin is a data model of the operation, detailed enough to simulate scenarios before you commit to them. Ahead of peak, a twin can test whether switching a carrier on one lane holds up under a 40% volume spike, so the control tower runs a plan that already passed the simulation. In sequence: the twin tests options, the control tower carries out the chosen one, and the visibility layer confirms the result.
A system that only shows status is visibility software, whatever the vendor calls it, and paying more for a control tower is justified only when its decision and execution layers are real.
A trend with few headlines and steady adoption
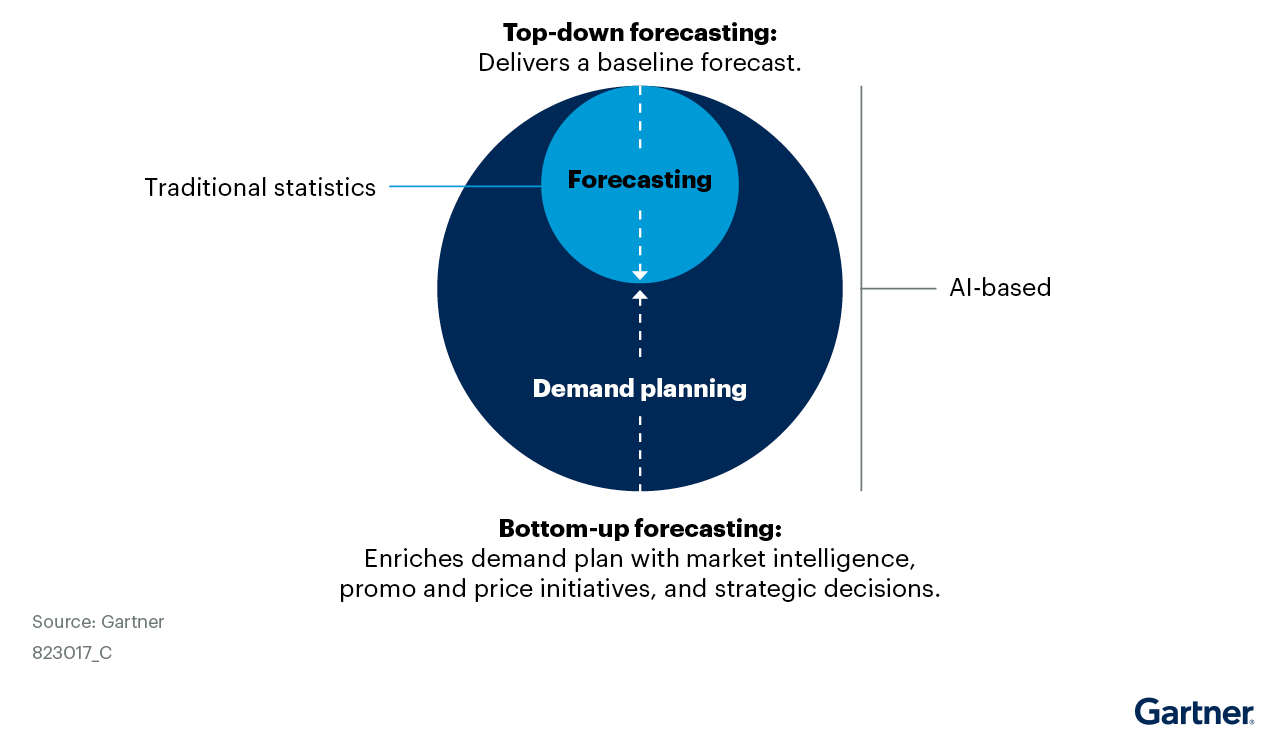
Of the ten trends, this one produced the fewest headlines in the first half of 2026, and the adoption pattern explains it. No flagship control-tower launch dominated the news. Predictive investment went bottom-up into discrete use cases, forecasting first, rather than into top-down network redesigns. Gartner expects 70% of large organizations to adopt AI-based supply chain forecasting by 2030, which points to years of gradual rollout rather than a finished capability. The progress is real but incremental, built up through better events, better models, and better data architecture rather than arriving as a single product.
When a control tower is worth the cost
A control tower justifies its price when it can answer four operational questions and act on the answers:
-
which orders are most at risk right now
-
which customers should hear from us before they ask
-
which carrier should take the next block of volume
-
which delivery promise should be pulled from checkout before a shopper selects it
A system that surfaces those questions but cannot route the answer into a booking, a notification, or a checkout rule is a more expensive dashboard.
Every delivery promise the network cannot keep becomes a late delivery, a WISMO contact, and a knock to repeat purchase. A control tower that pulls a two-day option in a postcode where the carrier is running three days late prevents that promise from being made, a decision taken in the checkout and driven by live carrier performance, which no status dashboard can make.
The gap becomes visible at the first real exception: the demo and the feeds both looked complete, and then a shipment breaks during peak and the alert lands on a screen nobody is watching that week. Acting on it in time depends on the alert reaching the workflow where someone can respond, not a dashboard reviewed once a week.
What sits under a working control tower
A control tower is only as good as the data and integration underneath it, which stack in a specific order.
At the base is event capture: every booking, scan, exception, and handover from every carrier, warehouse, and transport system. Above it, a normalized data layer turns each carrier's own formats, codes, and timestamps into one consistent model, so a delay from one carrier means the same as a delay from another. Above that, prediction, where forecasting and risk scoring run; then decision logic, which turns a prediction into a recommended action; and finally execution, which pushes that action into a booking, a notification, or a checkout rule.
In our experience, investment tends to concentrate in the top two layers, the analytics and the interface, and to underfund the bottom two. A prediction built on inconsistent event data produces unreliable output, however good the model. A recommended action with no route back into an operational system waits for someone to carry it out by hand, which during peak often means it does not happen. The event capture and normalization underneath are what most often decide whether a control tower works, and they are the parts buyers evaluate least.
The performance numbers are real and carry the fine print
The upside is well documented, and it rewards careful reading. McKinsey has reported that AI-driven forecasting can reduce forecast errors by 20 to 50% and cut lost sales and product unavailability by up to 65%. BCG found early adopters of value-chain digital twins reaching 20 to 30% better forecast accuracy and 50 to 80% reductions in delays and downtime.
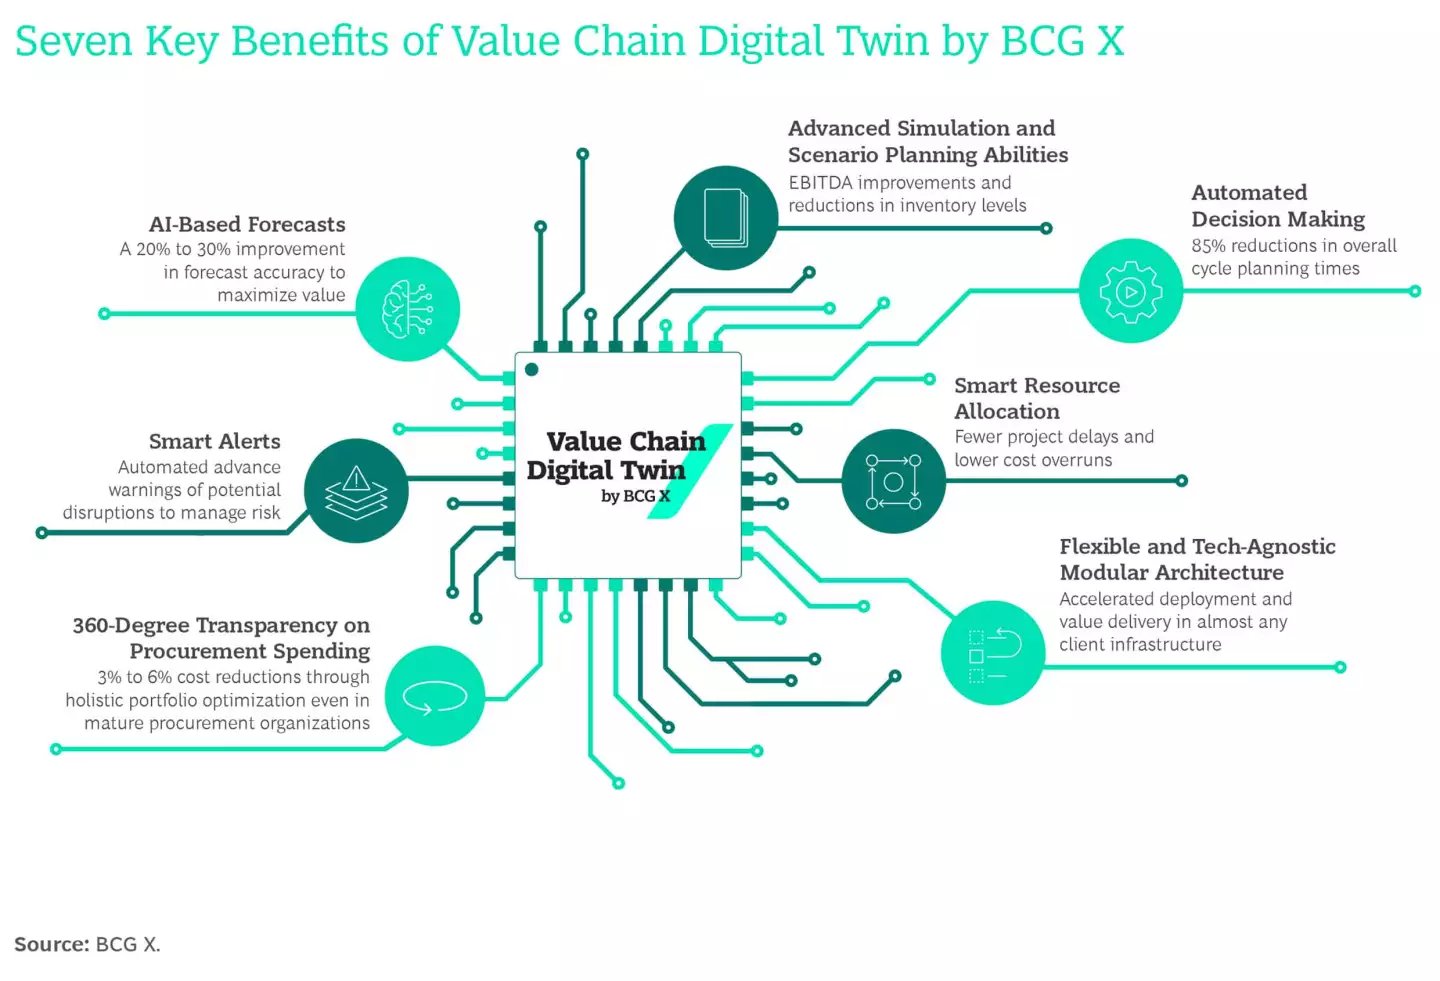
Those are strong results. They also come from advanced deployments, predate 2026, and neither is a default you can buy with the software. The best outcomes are high and typical ones are much lower, and the gap between them is mostly execution: data quality, integration depth, and whether anyone acts on the output.
70%
of large organizations to adopt AI-based supply chain forecasting
By 2030 (Gartner). A long build, not an arrived capability.
20-30%
better forecast accuracy for early digital-twin adopters
BCG. Advanced deployments, not a default outcome.
50-80%
fewer delays and downtime for those same early adopters
BCG. Results depend on clean data and acting on the output.
Where digital twins are becoming concrete
For years, digital twins in logistics stayed conceptual, because the underlying data was too fragmented to model and the use cases stayed vague. That changes where automation gives the model something concrete to mirror. DHL Supply Chain passed more than 500 million robot-enabled picks with Locus Robotics by 2024, the kind of instrumented operation where predictive coordination produces measurable throughput. Gartner expects half of new warehouses in developed markets to be designed as robot-centric facilities by 2030, with digital twins running real-time monitoring, routing, and storage inside them. A twin is only as accurate as the operation it models, and dense, sensor-rich warehouse automation produces exactly the detailed operating data a twin needs, which is one reason the most visible digital-twin progress is in automated warehouses. Public, comparable ROI benchmarks are still thin, so treat vendor case studies as direction rather than proof.
Grade your carrier events before you buy the tower
Carrier event data quality decides whether a control tower can act, and it is the thing buyers most often skip when they evaluate one. Before signing for analytics on top, grade the feeds underneath on four things: timeliness, consistency, exception detail, and handover visibility. A tower fed by late, vague, or contradictory events produces late, vague, or contradictory recommendations, whatever its models.
When one carrier reports a failed delivery as a numeric code, another as free text, and a third only the next morning, a tower cannot separate a genuine exception from a formatting difference in time to act. Normalizing those events into one consistent model, before any predictive layer, often does more for on-time performance than the analytics sitting on top of it, because it lets the tower trigger a reroute and a customer message on the day a problem appears rather than the day after.
Placement matters as much as data. Put the alerts and recommended actions inside the tools planners and customer service already use, not a separate portal opened once a week. A normalized event stream across carriers, the layer nShift's Data Fabric operates, removes the per-carrier translation work that would otherwise sit between raw carrier events and a control tower that can use them.
Where to start, if you are building toward one
If you are building toward a control tower, the order matters more than the platform choice.
Grade and fix the carrier feeds first, because prediction cannot outrun bad inputs. Then automate one decision end to end rather than visualizing ten. A single high-frequency choice, such as which at-risk orders trigger a proactive customer message, is a better first use case than a network-wide dashboard: it is measurable, and getting one decision to work end to end builds the integration that later decisions reuse. The interface comes last. Control towers tend to prove out one automated decision at a time, and steady progress usually comes from industrializing a few of them rather than installing a screen and hoping people watch it.
Pre-peak checks for a control-tower buyer
The mid-year picture is steady and the underlying pieces are improving through cleaner data and better models rather than through a single product. For a buyer assessing a control tower before peak, we can recommend these useful, practical checks:
-
grade the carrier feeds a future tower would depend on, since a weak feed caps everything above it
-
pick one delivery decision worth automating and measuring rather than a broad dashboard
-
confirm that the system can route its output into the booking, notification, or checkout workflow where the decision gets made, because a recommendation that stops at a screen rarely gets acted on during peak
For the full mid-year check-in across all ten trends, read the report. For the customer-facing side, nShift Track can turn a delay flagged upstream into a proactive update instead of a WISMO call.
More from the mid-year check-in:
- AI in logistics in 2026: the skills gap is the real constraint
- Warehouse robotics in 2026: where the delivery payback is
- Supply chain compliance in 2026: one data backbone, not ten projects
Ten trends. One mid-year evidence check.
Get the full 2026 delivery logistics mid-year check-in, with the data and recommendations behind all ten trends.
Get the report