






On-time delivery and transit accuracy
On-time delivery rate is the number of shipments delivered on or before their SLA date, divided by the total number of shipments delivered in the period, expressed as a percentage. When you measure the carrier, start the clock at the pickup scan, where the carrier's commitment begins. When you measure your own delivery promise to the customer, start at order confirmation. The two rates answer different questions, and a carrier review needs the first one. The finish line is the delivered event, never "out for delivery".
On-time delivery belongs in every carrier scorecard, but a single network-wide percentage is too blunt for routing decisions. Break it down by carrier, service level, lane, destination region and time period. In B2B supply chains, the same discipline often rolls up into OTIF (on time, in full), which combines delivery timing with order completeness.
Transit-time accuracy compares the actual delivery date with the estimated or promised date. A carrier can meet a generous three-day SLA while repeatedly missing a next-day promise on one lane. A network average will not expose that pattern.
First-attempt delivery success rate captures a cost that on-time metrics miss entirely. A parcel delivered on the second attempt might still count as "on time," but the failed first attempt generated a customer service contact, a redelivery cost, and a dent in customer confidence.
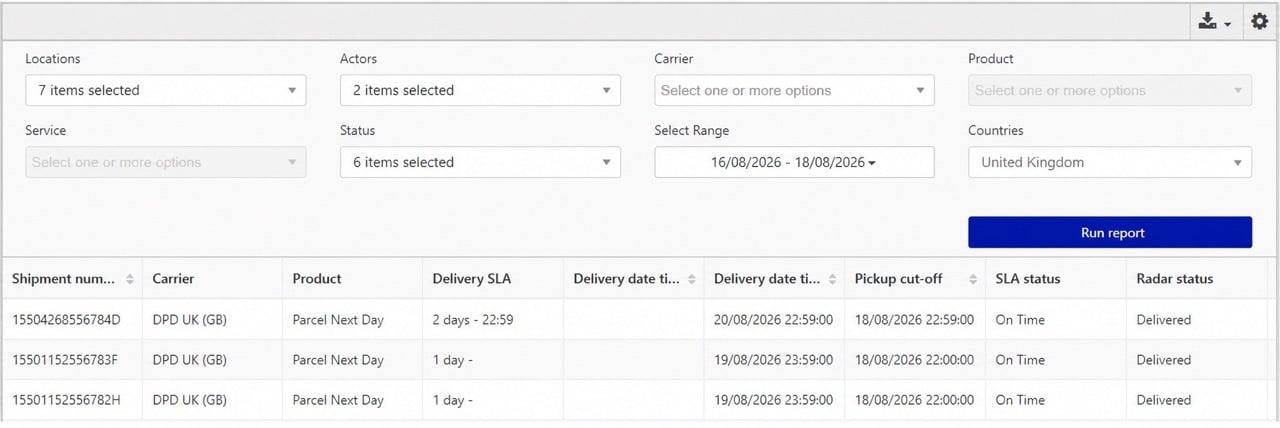
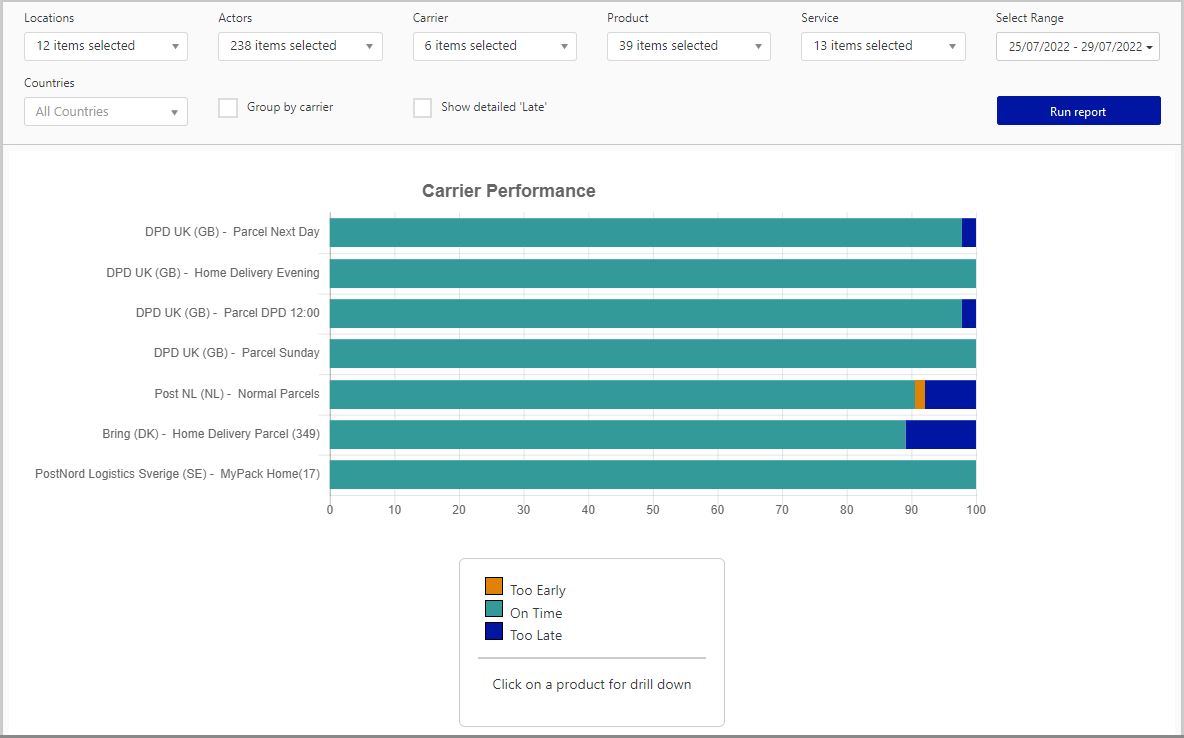
nShift Track's Carrier Performance Report measures these delivery performance metrics against carrier-specific SLAs, with filters for carrier, product and date range.
Exceptions and service quality
Exception rate tracks the events that disrupt delivery, including failed attempts, held parcels, misroutes, address issues and returns to sender. Across the network, it shows the overall service trend. By carrier and lane, it points to where the problem is occurring.
Damage and claims rates become more useful when segmented by route, carrier and package type. A high rate on one lane may point to a handling issue at a hub or a packaging mismatch for that route, giving the team something specific to investigate.
nShift Track's Performance Exception Detail report breaks down exception frequency by type across carriers. The normalized status library means the same exception category maps consistently regardless of how each carrier labels it internally.
Are your carriers charging what they quoted?
Carrier costs rarely match the rate card exactly. Accessorial charges, fuel surcharges, dimensional weight adjustments, and out-of-area fees accumulate. Rate adherence tracking compares what carriers quoted against what they actually charge, shipment by shipment.
Invoice deviation tracking goes further. nShift Track's invoice control compares your calculated freight rate against the carrier's billed amount and flags mismatches. The Deviation Report exports verified discrepancies for use in carrier billing reconciliation, turning a manual audit into a systematic process.
A systematic invoice audit can catch billing corrections that manual spot-checks miss, especially accessorial charges and dimensional weight adjustments that compound at high shipment volumes.
Rate adherence and invoice deviation tracking show whether the carrier billed what it quoted. The next level of auditing tests each invoice line against the contract and the shipment that actually moved. nShift is building towards that deeper freight and parcel invoice check. Talk to us about what's coming.
How much can you see between pickup and delivery?
A carrier may deliver on time and still create extra work if it provides little information between pickup and delivery. Sparse scan data drives customer questions, internal workarounds and tracking pages with no useful update to show.
Status reporting quality measures whether shipments receive confirmed pickup, in-transit and delivered events. Some carriers provide fifteen events per shipment; others provide two. That difference affects customer service visibility and the quality of the post-purchase experience.
For nShift TMS customers, the Analytics Status sheet compares carrier status quality over time, including the percentage of shipments with each event type.
How to build a carrier scorecard
To build a carrier scorecard, measure every carrier on the same metrics against each lane's SLA, then weight those metrics by what you pay each service to deliver. Give each carrier, service and lane its own row, and each metric its own column: on-time delivery rate, transit-time accuracy, first-attempt success, exception rate, damage and claims, rate adherence and invoice accuracy, and status reporting quality. Use the same normalized shipment events for every cell, so a carrier that scans less often doesn't appear to deliver faster.
Weight each service by its delivery promise. A premium next-day service justifies its price with on-time delivery and first-attempt success, so those two metrics should carry most of its weight. For an economy service to a rural region, you can put less weight on on-time delivery and more on cost per shipment and rate adherence. Weight lanes by volume and by exposure: the lane that carries most of your parcels, or your highest-value orders, counts for more in the carrier's overall result than a lane with a handful of shipments a week. Score each lane on its own before rolling anything up, because a network average hides the one lane that is generating the complaints.
The rolled-up result is the carrier performance score: one weighted number per carrier, calculated on the same scale over rolling seven-day, 30-day and quarterly windows. That way a dip during a peak week looks different from a longer-term decline. Document the weights and name someone who approves changes, so you can back up the score when you evaluate carrier performance in a review and the carrier questions it. Review the lane-level results before the overall score. Use the overall score to decide which carrier to speak with, and the lane-level results to decide what to discuss. The same numbers then feed the weekly check on the carrier performance dashboard, the quarterly review and your next carrier tender, when you put lanes out to bid.
Carrier SLA management keeps the scorecard honest. It means documenting the transit window, cutoff time and on-time threshold for each carrier, service and lane, measuring every shipment against those definitions rather than the carrier's own report, and using repeated breaches to inform routing rules and the next carrier review. The definitions need updating when a contract changes, a cutoff shifts or a carrier adds a service, so assign an owner and set a review date. nShift Track's Carrier Performance Report shows delivery against the SLAs you document, with filters for carrier, product and date range.