Delivery KPIs are the metrics that show whether your delivery promise holds in practice. Eight cover the ground: on-time delivery against the promise, first-attempt success, exception rate and time to action, WISMO contact rate, returns cycle time, cost to serve per delivered order, carrier performance by market, and emissions per shipment. Together they answer the delivery question boards actually ask: did it show up when we said it would, and what did it cost us?
Most delivery reporting arrives as carrier scorecards and average transit times. Those numbers describe the carrier's world, not whether the customer received what was promised.
The set of KPIs below will give the board something to act on when performance changes.
Measure against the promise, not the carrier's SLA
Measure delivery performance against the promise the customer saw at checkout, not against the carrier's internal SLA.
A carrier can hit 98% of its own SLA while your customers experience missed Thursdays, because the SLA clock starts at collection and your promise started at the order confirmation. Only one of those shows up in your reviews.
The gap explains most disputes with carriers: the customer's clock starts when they click buy. Between that click and the carrier's first scan sit your order cut-off, the warehouse pick, the packing queue, and the collection schedule, and none of that time exists in the carrier's measurement. Add a promise expressed as a date ("Thursday") against a carrier service expressed in transit days ("48 hours from collection"), and the two systems can both be telling the truth while the customer waits. Measure every KPI below from the customer's side. That requires delivery data in one place rather than one portal per carrier.
The eight delivery KPIs
1. On-time delivery vs promise
What this is: the share of orders delivered within the window promised at checkout.
This is the headline number, the one that summarizes whether the machine works. Measure it end to end, order confirmation to handover, and segment by market, carrier, and delivery option.
A high on-time rate can still hide an uncompetitive promise. Review it alongside checkout conversion to see whether the promise is both achievable and attractive.
2. First-attempt success rate
What this is: the share of deliveries completed on the first visit.
A failed attempt triggers a second run, depot re-handling, a support contact, and sometimes a refund, which makes this the number with the most cost hanging off it.
Chase the preventable causes: address quality at checkout, the option mix you offered, ETA accuracy, and whether a reroute was possible. Segment it by delivery option as well as by carrier, because a rising share of locker and pickup-point deliveries lifts the number by design: the parcel waits for the customer instead of gambling on the doorstep.
The failure modes and fixes are unpacked in our guide to last mile delivery challenges.
3. Exception rate, and time to action
What this is: two numbers that work as a pair - how often delivery journeys go wrong, and how long it takes your team to notice and act.
A missing scan caught within hours becomes a real fix; the same scan caught three days later has already become a support ticket and a refund conversation.
This also requires monitoring for non-events. A dashboard that only displays the scans carriers send cannot detect the scan that should have arrived but did not.
Track how many exceptions your team identifies before the customer reports them. As monitoring improves, that share should rise.
4. WISMO contact rate
What this is: "Where is my order?" contacts per hundred shipments.
Every one is a customer who hit a visibility gap before you did and volunteered to do your monitoring, at contact-center prices. Falling WISMO is visibility doing its job: consistent milestones, proactive notifications tied to real status, and exceptions handled before the customer notices.
Track it next to the missing and late scans that set it off, so you can connect the contact rate to its operational causes.
5. Returns cycle time
What this is: days from return initiation to resolved, counted in days you can shorten.
This is the window in which your cash, your stock, and the customer's goodwill are all tied up at once, and it is worth watching closely: NRF and Happy Returns put US returns at 16.9% of 2024 sales, roughly $890 billion. The lever is the refund-release rule.
Decide which event releases the money, first carrier scan or warehouse receipt, and automate it, so the refund releases automatically instead of after a complaint.
16.9%
of 2024 US retail sales were returned, roughly $890 billion
NRF and Happy Returns, a UPS company
6. Cost to serve per delivered order
What this is: the full cost of getting an order to a customer who keeps it - fulfillment, delivery, failed attempts, support contacts, and returns handling, divided by delivered orders.
Keep it separate from cost per shipped order. The difference shows how much failed deliveries, support and returns add after dispatch.
The full method is in our cost to serve piece.
7. Carrier performance by market
What this is: comparable event data across carriers, normalized so that a slow carrier and a carrier that scans less often stop looking identical.
Without normalization, every carrier conversation runs on anecdote, and a peak-season wobble becomes a debate instead of a decision. With it, re-ranking volume between carriers becomes something you do based on evidence, per market, before the customer feels the difference. The full metric set behind that comparison is in our carrier performance measurement guide.
Use the same data in carrier tenders. A carrier scorecard built on your own parcels and lanes gives you a more relevant basis for comparison and negotiation than a general market benchmark.
8. Emissions per shipment
What this is: CO2e per parcel, consistent across carriers and markets.
Boards and procurement teams increasingly expect this view, but comparable coverage across the network is more useful than precise data for one lane that cannot be combined with the rest. Avoid a per-carrier patchwork where each carrier uses a different method.
Once the data is consistent, you can identify and promote lower-emission services at checkout.
Delivery KPIs vs logistics KPIs
Logistics KPIs cover internal operations such as warehouse throughput, pick accuracy, transport cost per unit and fleet utilization. Delivery KPIs cover the customer-facing result: whether the order arrived as promised, what it cost and how much friction it created. An operation can perform well internally while still missing the delivery promise.
Report both sets side by side. For the internal operations view, start with our guide to warehouse KPIs.
Baseline before you change anything
The KPI mistake that costs the most is starting the improvement program before recording the starting point. You cannot prove a delivery program improved if you never measured what it looked like broken, and delivery investments compete for budget against initiatives that can prove their effect. A baseline is what turns "deliveries feel better this quarter" into a slide with a before and an after.
The discipline consists of four steps:
-
Baseline all eight KPIs for a full trading period, peak included if you can get it, because peak is when you most need them.
-
Segment each by market, carrier, and delivery option, since averages hide exactly the orders that cost the most.
-
Set the review cadence, weekly for operations, monthly for the board line.
-
Where possible, change one thing at a time so you can connect the result to the intervention.
Reliable measurement needs event data from every carrier in one format and one place. The nShift platform normalizes carrier events into one stream across checkout, shipment, tracking and returns, so the same data used to run delivery can support the KPI reporting. Within delivery management, the KPI work compounds: each improvement gets easier to justify once you can show its number moving.
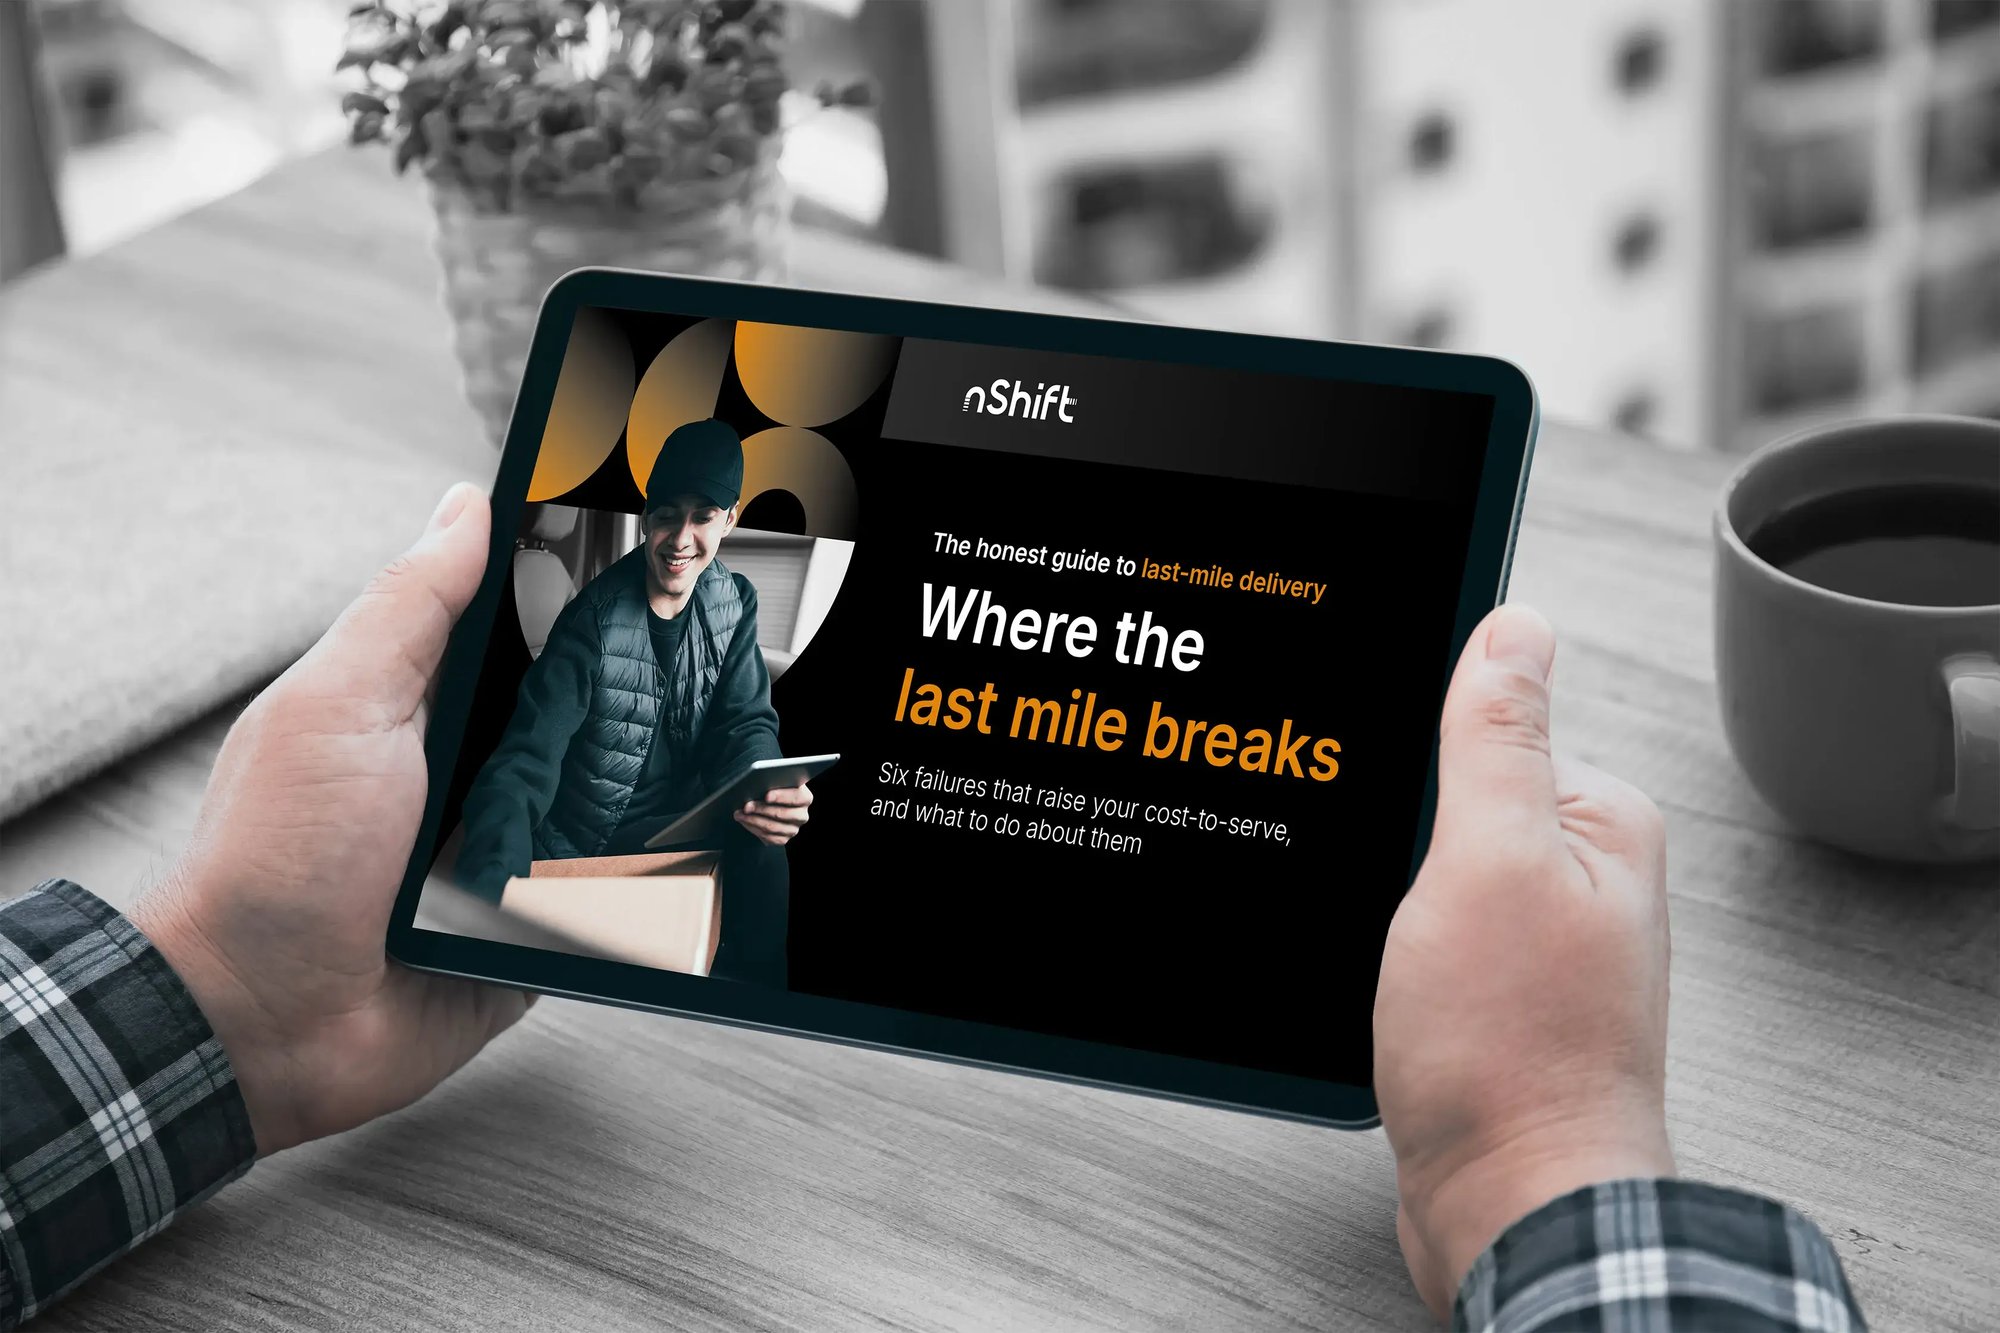
These eight KPIs came out of our latest guide on where the last mile breaks, which pairs them with the failure they each catch, a feature checklist, and the buy-or-build decision matrix.
Delivery KPI FAQs
What is a good on-time delivery rate?
How is on-time delivery measured?
What is the difference between delivery KPIs and logistics KPIs?
How often should delivery KPIs be reviewed?

About the author
Gregory Mannix
Delivery Expert
With over 20 years of experience in SaaS, ecommerce, and logistics, Greg Mannix helps retailers and logistics providers streamline delivery operations. His expertise includes optimizing carrier management, enhancing tracking visibility, and simplifying returns to improve efficiency and customer satisfaction.