Cost to serve is the total cost of getting one order from checkout to a customer who keeps it: picking, packing, shipping, failed attempts, support contacts, returns handling, and the overhead behind all of it, counted per order. Most businesses track the shipping line and stop there. The margin leaks everywhere else.
That gap explains a familiar frustration: the carrier invoice looks fine, the freight rates were negotiated hard, and the delivery budget still creeps up every quarter. The invoice was never the problem - the issue is everything the invoice does not show: the second delivery attempt, the "where is my order?" email, the refund that went out while the return sat unscanned in a depot.
Cost to serve is the discipline of counting all of it, so you can see which orders make money, which lose it, and what to fix first.
What is cost to serve?
Cost to serve is the full cost of serving one customer order, from picking it in the warehouse to the day the customer decides to keep what they received. It is expressed per order so you can compare it with the margin that order earned. Cost of goods tells you what the product cost you; cost to serve tells you what it cost to get that product to the customer, in that market, through that delivery option, and to keep the sale after delivery. At the order level, it answers an ecommerce profitability question that gets lost in P&L averages: which customers, markets and delivery options earn their keep.
A workable cost to serve analysis counts every cost an order triggers on its way to the customer, not just the ones with a line on an invoice. For an ecommerce order, that list runs longer than most teams expect:
- Fulfillment: picking, packing, materials, and the warehouse share of that order
- Delivery: the carrier charge, surcharges, and fuel adjustments
- Failure: re-delivery attempts, re-handling at the depot, and parcels returned to sender
- Support: every contact the order generates, most of them some version of "where is it?"
- Returns: return shipping, receiving, grading, and the time stock spends unsellable
- Payment friction: refunds issued early to calm a customer, chargebacks, goodwill credits
Sum those per order and segment the result by market, carrier, product type, and delivery option. A slice of orders will carry costs far above what anyone assumed, and those orders share causes you can act on.
Why delivery is where cost to serve hides
Production costs get audited, marketing costs get attributed but delivery costs get averaged.
And an average is easy to hide in: a £4.50 average delivery cost can contain thousands of first-time-right deliveries at £3.80 and a long tail of orders that cost £15 or more once the failed attempt, the extra depot handling, the support thread, and the refund are counted.
Nothing about the average moves - so nobody looks.
Those expensive orders come from specific, fixable failures in the delivery chain, and the failures compound: a shaky promise at checkout raises the odds of a missed delivery, which triggers the support contact, which ends in a refund or a return. We wrote a whole guide about those failures.
The six delivery failures that inflate cost to serve
1. A checkout promise the operation never agreed to
The delivery promise is the most consequential sentence in the transaction, and it can cost you twice. Baymard Institute puts average cart abandonment at 70.22% across 50 studies, with extra costs at checkout the biggest fixable reason, named by 39% of abandoners, and slow delivery on the same list at 21%. So an unattractive promise loses the sale. An attractive promise the operation can't execute loses the customer, and adds a failed delivery, a support thread, and sometimes a refund to the bill.
The fix is connecting the promise to what decides it: carrier cut-offs, live service availability, and the postcode in front of you.
70.22%
average cart abandonment rate
Baymard Institute, across 50 studies
39%
abandon over extra costs at checkout, the top fixable reason
Baymard Institute
21%
abandon because delivery is too slow
Baymard Institute
2. The failed first attempt
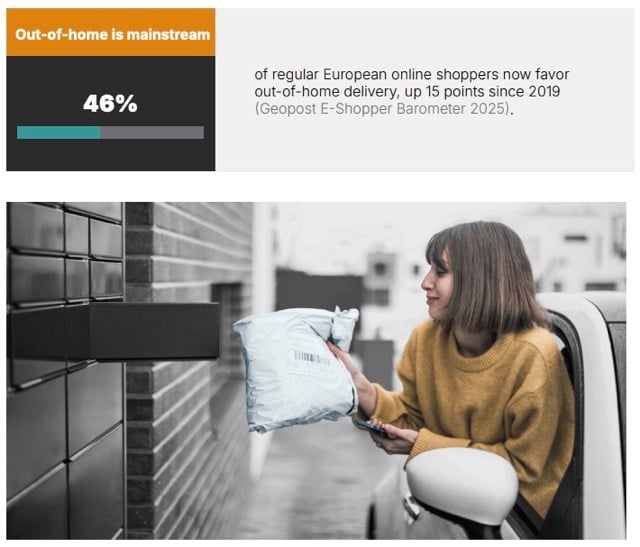
A driver knocks, nobody is home, and the parcel goes back to the depot for another try tomorrow. Nothing was delivered, nothing was resolved, and the meter ran the whole time: a second run, extra depot handling, a "where is my order?" contact, often a refund once patience runs out. Most of these failures were set up at checkout and in the notification flow; fix those two stages and far fewer first attempts fail. The full breakdown is in our last mile delivery challenges piece.
3. Out-of-home options that only half work
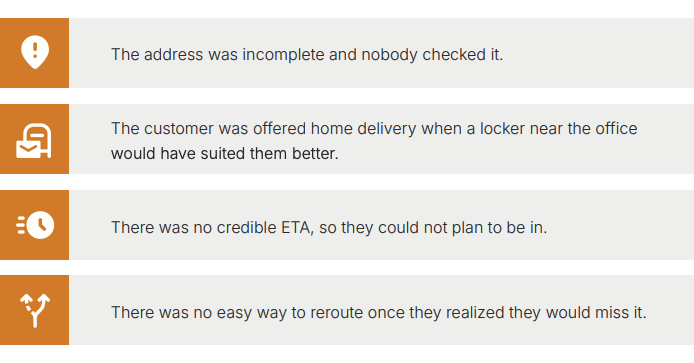
Lockers and pickup points are the strongest answer to the failed doorstep, and 46% of regular European online shoppers now favor out-of-home delivery, per Geopost's E-Shopper Barometer 2025. The economics only hold when the option works: a full locker or a pickup point that no longer exists converts a cheap delivery into a wasted trip, a support contact, and a customer who did the work and still didn't get the parcel. Managed eligibility and live availability keep out-of-home the cost saver it is supposed to be.
4. Tracking that watches nothing
When carrier scans go missing, arrive late, or get labeled differently by each carrier, the tracking page stops meaning anything, and the customer notices before you do. Every "where is my order?" contact is a visibility gap surfacing as a support cost. Consistent milestones across carriers, and alerts when an expected scan is missing, turn that cost into a task someone handles before it becomes a ticket.
A customer will forgive a delay they saw coming.
5. The return that moved in and never left
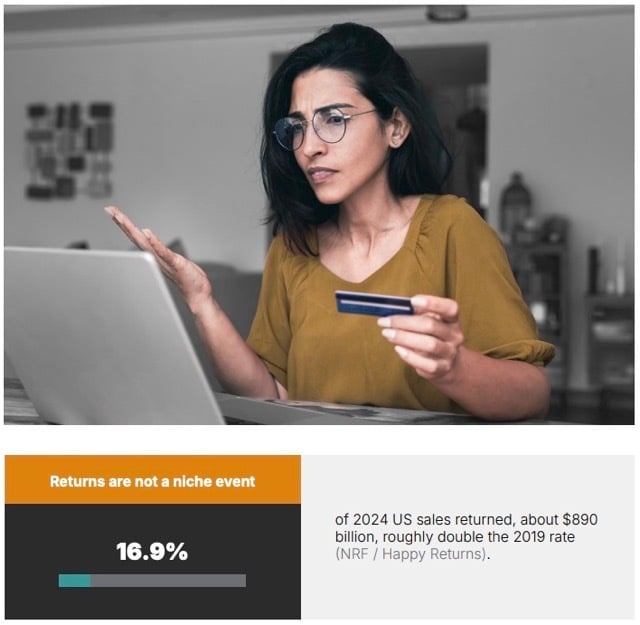
In the US, NRF put 2024 returns at 16.9% of sales, roughly $890 billion. A return is money you already collected, tied up next to stock you cannot resell because nobody can say where it is. The longer initiation, transit, and refund stay disconnected, the more each return costs in cash, support time, and resale value. One timeline from initiation to resolution, and a deliberate rule for which event releases the refund, shrinks all three.
6. Integrations that age like milk
Every carrier connection built in-house is a small standing cost that compounds: label specs change, APIs deprecate, service rules move, and each market adds its own stack of them. That maintenance sits in engineering budgets, so it rarely gets surfaced in delivery cost conversations, even though it decides how expensive it is to add a carrier, switch one mid-peak, or enter the market that keeps slipping down the roadmap.
It also decides your exposure when a carrier wobbles in December.
If switching volume to the backup carrier is a project rather than a configuration change, you ride out the wobble instead, and the failed deliveries it produces get absorbed in your cost to serve, not the carrier's. Being able to reconfigure connectivity without an engineering project is cheap insurance.
How to run a cost to serve analysis
To run a cost to serve analysis, take the orders from a set period, assign every cost each order triggered, and compare the totals across segments to see which orders cost the most and why. You don't need a perfect activity-based costing model for the analysis to be useful. You do need to count the failure costs. A workable version comes together in four steps:
- Pick the unit. Cost per delivered order, kept separate from cost per shipped order. The difference between those two numbers is your failure cost, and watching it move is the point.
- Attach the direct costs. Fulfillment and carrier charges per order, from the systems that already hold them.
- Attach the failure costs. Re-delivery attempts, support contacts, refunds, and returns handling, allocated to the orders that caused them rather than smeared across all orders. This is the step most models skip, and the reason most models flatter the operation.
- Segment. By market, carrier, delivery option, and product type. The segments answer the questions the average cannot: which carrier's cheap rate turns expensive once failures are counted, which market's returns take three weeks to resolve, which delivery option pays for itself in fewer support contacts.
Each cost line comes from the system that produced it, and each system records it differently. The carrier invoice holds the delivery lines: base rate, fuel and residential surcharges, and the separate charges for a second attempt or a return to sender, each tied to a tracking number. The returns system holds the return label, the receiving and grading time, and the days the item sat unsellable. The support desk records the WISMO contacts (the "where is my order?" tickets), which take time to handle and usually include the order number. Packaging costs come from the pack station: the box, the fill and the label stock per order. Most analyses leave these costs in overhead because nobody has tied them to an order.
To allocate these costs, match the records by order number. A carrier invoice line includes a tracking number, which the shipping system maps to an order; a return is linked to the original order; and a support ticket includes the order number whenever the desk captures it. Match these records to the order table and each order has its own delivery, failure, support and returns cost instead of a share of the total. A cost that cannot be tied to an order (a monthly depot fee or a bulk surcharge) is allocated by what caused it: parcel count for a handling fee, weight for a fuel adjustment. Keep these costs separate from the order-level costs so they don't blur the cost of individual failures.
The data for the last three steps already exists in most operations.
But it's usually spread across checkout, carrier portals per carrier, support desks, and returns processes, none of which share the same definition of "delivered". One system counts a delivery at the first scan, another at the handover, a third when the customer stops emailing about it.
Reconciling those definitions by hand is why cost to serve projects so often run once, impress everyone, and never run again. Pulling delivery events into one normalized stream is what makes the model a weekly report instead of a quarterly archaeology project, which is the job of a delivery data layer underneath the model.
A cost to serve model for delivery
A cost to serve model for delivery is an ongoing version of the analysis above: one row per order, updated as delivery events come in, with the shipped cost, the delivered cost and the gap between them side by side. The model extends the analysis: it forecasts what the next order will cost before you accept it, using the cost of each delivery option by postcode, basket size, carrier and service, based on data from previous orders.
Four inputs do most of the work: the order-level costs from the analysis, matched by order number; the carrier rate card and surcharge table, so a new order can be priced before a label exists; the failure rates by option and area (first-attempt success by postcode, the share of locker orders never collected, and the contact rate per hundred orders for each service); and the margin per order from the commerce platform, because you need to compare the delivery cost with what the basket earned.
With costs by option in the model, you can decide which delivery options to show and at what price for each order, rather than applying one policy to every order. The £4.50 average from earlier breaks down into first-time-right deliveries at £3.80 and orders that cost £15 or more after a failed attempt. The model shows which postcodes, options and basket sizes each group came from. So the checkout can put a locker first where doorstep attempts fail, charge for next-day delivery where the cut-off is tight, and hide a premium service for a basket that cannot cover its cost. Pricing delivery before the order ships lets you manage its effect on margin, instead of discovering the cost later in the margin review.
You can use the same order-level data to set delivery thresholds. A free shipping threshold is a bet that the extra basket value covers the delivery cost you absorb. The model calculates that cost for each segment: the cost to serve for a free delivery in one market or product category differs from the average, so a threshold that protects margin in one segment can give margin away in another. The same data sets the minimum basket value for a premium service and shows which orders should carry a delivery charge at all. Our guide to setting up free delivery covers the threshold math; the model supplies the cost side of it.
Updated weekly, the model also reflects seasonal changes. Failure rates in April are rarely the same as in December. A model refreshed with live delivery events shows when the delivered cost is rising, which gives you time to adjust the delivery option mix and thresholds for peak instead of discovering the increase in the January margin review.
Where to cut first
Start with the promise. Tie the checkout promise to carrier cut-offs, capacity, and postcode-level service availability. More accurate promises remove failures, contacts, and refunds downstream, which is why this beats renegotiating carrier rates as a first move.
Then the first attempt. Validate addresses at checkout, offer lockers and pickup points to the customers they suit, and send an ETA someone can plan around. First-attempt success is the single number with the most costs hanging off it.
Then returns. Decide which event releases the refund and automate it. Cash stops leaking through goodwill refunds, stock returns to sale while it still sells, and "where is my refund?" contacts fall away on their own.
Then measure the effect where finance can see it. Our related article on delivery KPIs covers the eight numbers worth reporting, starting with on-time against the promise the customer actually saw.
The guide this article grew from goes deeper on each failure, and adds the buy-or-build decision matrix and the feature checklist to take into your own operation.
What we do about it
nShift connects the checkout to the carriers that execute the promise, and to the tracking and returns flows that prove it. In practice: the delivery options a customer sees are ones the network can deliver that day, a missing scan gets flagged while it is still a small problem, and every delivery event lands in one platform, ready for the cost to serve model described above.