DHL surveyed 29,000 shoppers and 5,800 businesses for its 2026 E-Commerce Trends Report, published in June, putting both sets of answers side by side for the first time. We read it alongside DHL's two 2025 studies and our own delivery research, looking for the changes that hold up once the methodology is taken into account and the operational questions behind them.
DHL eCommerce published its 2026 E-Commerce Trends Report on 2 June. It is the fifth edition, and the first to survey shoppers and businesses in one study: 29,000 online shoppers across 29 countries and 5,800 ecommerce businesses across 28, with fieldwork between December 2025 and February 2026. The report's own frame is the gap between what shoppers expect and what businesses deliver, across cross-border buying, checkout, payments, subscriptions, sustainability, AI, delivery and returns.
Our relationship with DHL goes well beyond reading each other's research. DHL is a long-standing carrier partner of nShift, we are listed in its digital partner directory, and our carrier library includes 17 DHL entities, from DHL Express and DHL Parcel to national DHL Freight operations. We have also worked directly with DHL Germany on parcel locker growth at checkout. Alongside that partnership, we run our own research into the same market, including the 2026 delivery and logistics trends report and our mid-year check-in. So when DHL puts 29,000 shopper interviews on the table, it is a dataset we read with particular interest.
DHL has already drawn the headline conclusions: delivery affects whether the sale happens, lockers and parcel shops are becoming the default in some markets, cross-border delivery has to feel local, and shoppers and businesses explain returns differently. From our side of the industry, the interesting part is what businesses have to run, change and pay for as those expectations rise.
Key findings in one glance
-
The 2025 to 2026 jump in delivery-driven cart abandonment comes from a changed question format. The figures that held across both years put delivery close to the ceiling of importance to the sale in both editions.
-
Shoppers and businesses disagree about why carts are abandoned. Every delivery-related reason scores 15 to 18 points higher on the shopper side than on the business side.
-
Nine in ten businesses run more than one carrier, and 57% run three or more. Out-of-home delivery has reached three in ten shoppers globally and four in ten in Europe.
-
Cross-border buying rose from 60% to 70% of shoppers in a year, the one year-on-year change DHL states directly, while the business side stayed roughly flat.
-
Shoppers and businesses have explained returns differently for two years running. The reasons belong with product content, packaging and pricing teams as much as with the returns desk.
Why the 2025 and 2026 abandonment figures are not directly comparable
The 2025 research came in two separate editions: a Shopper Edit covering 24,000 shoppers in 24 markets, and a Business Edit covering 4,050 businesses in 19. The 2026 report brings both sides into one larger study. DHL states the year-on-year change in cross-border buying explicitly, so that number is safe to treat as a direct comparison. Most of the others need more care because the samples changed and, in one important case, so did the question.
The cart-abandonment figures are not directly comparable. In 2025, shoppers chose their reasons from a list and the top answer, slow delivery, reached 36%. In 2026, DHL asked about each reason separately as a yes-or-no question; 67% then said the delivery offering had caused them to abandon a purchase. Put those figures next to each other and it looks as though delivery-driven abandonment nearly doubled. The change in question format does not support that conclusion. Customs charges jump from 33% to 63% and payment methods from 35% to 62% on the same page, a good sign that the answer format is doing much of the work. The business figures behave the same way: 31% named delivery in 2025, while 52% answer yes in 2026.
The steadier numbers tell us more. In 2025, 81% of shoppers said they would abandon a cart if their preferred delivery option was missing, and 79% said the same for returns. In 2026, seven in ten say they will abandon when the delivery or returns options they want are missing at checkout. Seven in ten will not shop with a brand whose delivery and returns provider they do not trust, a result that holds across both years. On the business side, delivery remains close to universally important: nine in ten say the delivery and returns offer helps secure online sales, and 88% say free delivery and returns improve sales.
| Figure | 2025 | 2026 |
|---|---|---|
| Shoppers who abandon a cart if the delivery option they want is missing | 81% | 7 in 10 |
| Shoppers who will not buy from a brand whose delivery and returns provider they do not trust | 7 in 10 | 7 in 10 |
| Businesses saying the delivery and returns offer is important to securing online sales | 96% | 9 in 10 |
| Businesses saying free delivery and returns improve sales | 86% | 88% |
Sources: DHL E-Commerce Trends Report 2025, Shopper Edit and Business Edit; DHL 2026 E-Commerce Trends Report, chapter 8.
Delivery was already close to the ceiling of importance to the sale in 2025. The useful addition in 2026 is seeing shopper and business answers to the same questions on the same page. The gaps between them are where things get interesting.
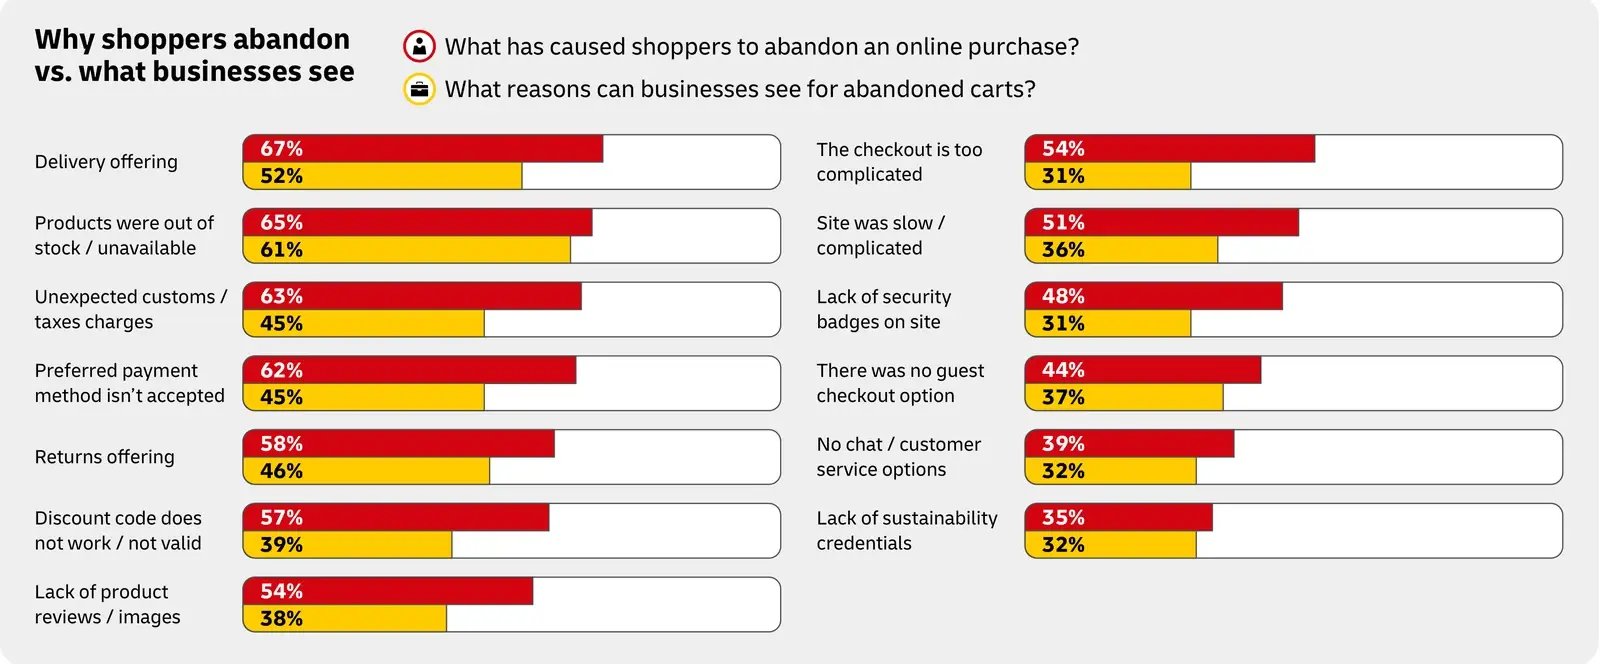
Why shoppers abandon versus what businesses see. Source: DHL eCommerce, 2026 E-Commerce Trends Report, chapter 3, page 17. The 2026 question was asked per reason as yes or no, so these figures are not comparable with the 2025 multiple-choice list.
Shoppers and businesses disagree about why carts are abandoned
On the 2026 abandonment page, businesses put stock availability first (61% see it), then delivery (52%), then returns (46%). Shoppers put delivery first (67%), then stock (65%), then customs charges (63%) and payment (62%). Every delivery-adjacent reason is 15 to 18 points higher on the shopper side. DHL calls this the expectation gap.
What catches our eye here is how little of that delivery context most checkout analytics capture. A business can see that a shopper reached the shipping step and left. It may not be able to see which options appeared for that postcode, which one was missing, or whether the price shown matched what the shopper expected. DHL's shopper answers fill in some of what the business data misses.
To close that blind spot, record the delivery options shown, the option chosen and the orders that stalled at the shipping step, broken down by market and basket size. Just as importantly, make those options easy to change. Flying Tiger Copenhagen rebuilt its delivery choices around pickup points with nShift Checkout and recorded a 20% increase in conversions, with 70% of customers preferring the new pickup option. The lift came from matching the delivery offer to how customers actually chose to collect, not simply from adding more pickup points.
Free delivery is a promise the operation has to fund
DHL's shopper data puts free shipping at the top of what would have encouraged a purchase, chosen by half of shoppers, ahead of faster delivery. Businesses see it the same way: 88% say free delivery and returns improve sales, and free delivery is the second most used conversion tactic after discounts.
In 2026, 47% of businesses offer delivery entirely free, 35% use a mix of free and charged delivery, and 18% charge. Among B2B and Asia-Pacific businesses, 57% build logistics cost into the product price to create the perception of free. The 2025 Business Edit showed the same range of approaches. Either way, the delivery cost sits somewhere: in product margin, a free-shipping threshold, a subscription fee or the charge shown at checkout. The final amount may only become clear weeks later, when the carrier invoice arrives.
Carrier and service choice determine a large part of that cost. A next-day promise can push an order onto a more expensive service; a pickup option can move volume toward a cheaper part of the network. If delivery is helping win the sale, finance also needs to follow that promise through to the final charge. Published freight audit benchmarks put recoverable carrier-invoice overcharges at 3 to 7% of freight spend. nShift Audit checks invoice lines against the agreed tariff and the shipment that actually ran.
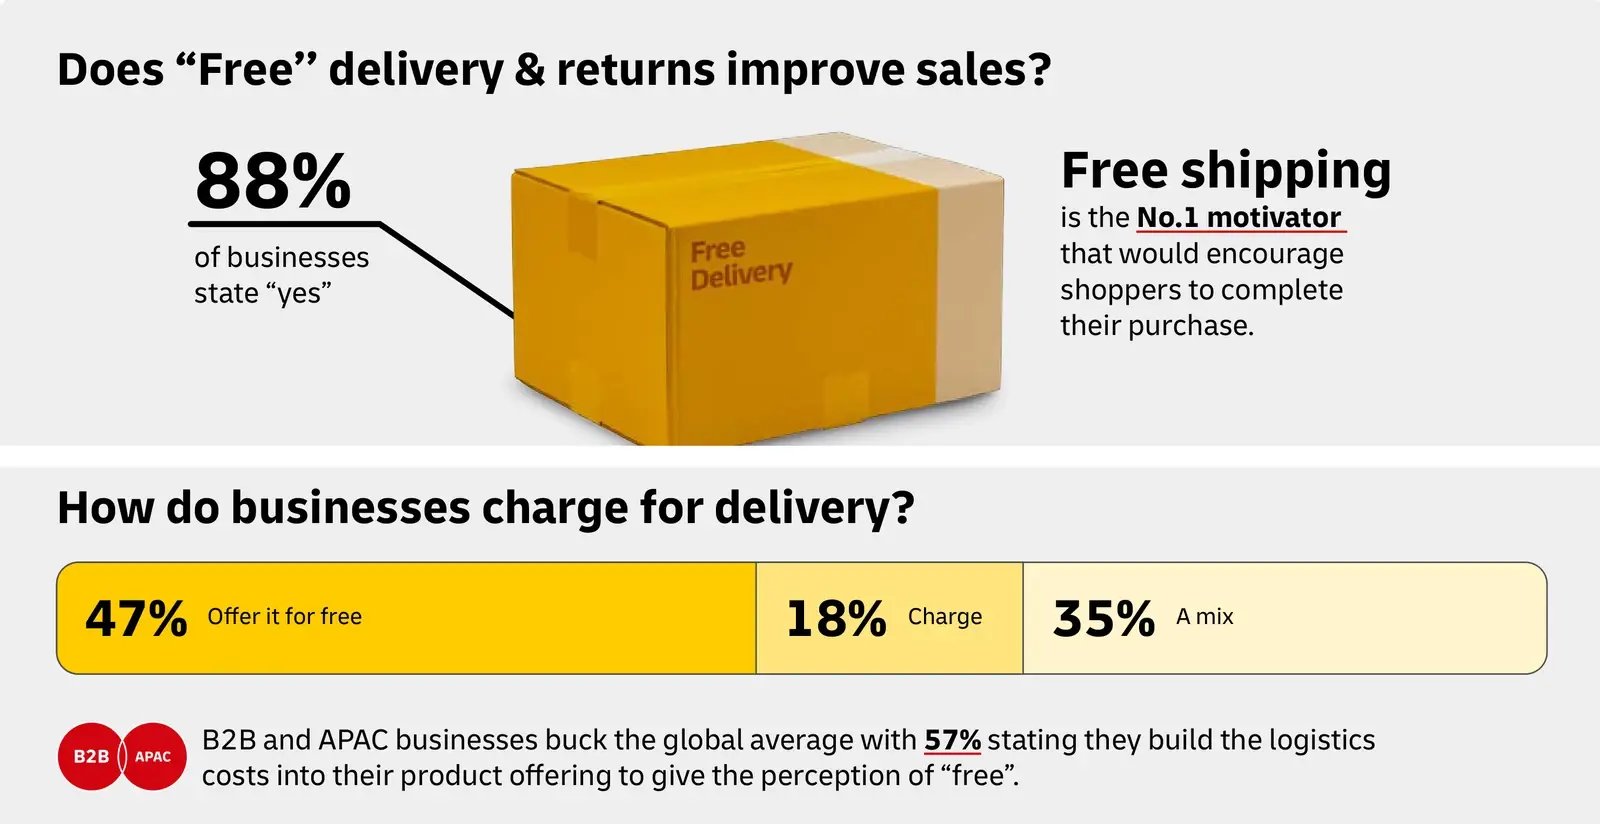
Does free delivery and returns improve sales, and how businesses charge for delivery. Source: DHL eCommerce, 2026 E-Commerce Trends Report, chapter 8, page 34.
More choice at checkout means more carriers behind it
Only 10% of the businesses DHL surveyed use a single logistics brand for delivery and returns. A third use two, 32% use three, 14% use four, and 11% use five or more. That puts 57% on three or more logistics brands, compared with 43% partnering with three or more providers in the 2025 Business Edit. The samples differ, so this is directional rather than a clean measured increase.
In 2025, 87% of businesses said they regularly reviewed their delivery and returns offering, and 80% described switching providers as easy or somewhat easy. Multi-carrier does not necessarily mean a fixed network.
In 2026, 18% of shoppers globally have parcels delivered to a locker and 11% to a parcel shop, putting almost three in ten deliveries out of home, against 25% in 2025. In Europe the share is 40%, against 35%. Returns got there earlier and have stayed there: more than six in ten globally, and three quarters in Europe, go back through a locker or shop. Businesses have noticed. In 2026, 97% say out-of-home locations are essential to securing sales and repeat business, and 46% of European businesses drop their own outbound shipments at lockers or shops.
The market differences are substantial. In DHL's 2025 country data, 56% of Polish shoppers had parcels delivered to a locker; in Brazil it was 2%. A locker option deserves much more prominence in Poland or Germany, where DHL's Packstation network alone is within ten minutes of nine in ten residents, than in a market where home delivery still dominates. The checkout may show one neat delivery menu. Behind it can sit a different carrier mix, pickup network, cut-off time and returns route in every country.
"Ecommerce customers across Europe increasingly expect PUDO deliveries. Working with nShift, we now have the ability to successfully scale with confidence that we can expand the number of PUDO points we offer in both established and new markets."
Sander van Enschot, Head of Digital Operations, Flying Tiger Copenhagen
Rebelz, a Swedish sports retailer with two full-time employees, ships to 54 countries across PostNord, DPD, FedEx, UPS and DHL, using checkout rules to decide which delivery methods appear and which carrier handles them in each market. Flügger, a Danish manufacturer with factories in four countries, runs five B2B webshops with pickup options alongside GLS, PostNord and DHL, and changes the setup itself with zero developer hours per checkout change. Carrier connectivity lets the business control that setup in one place while the carriers run the transport. That is also where our own vantage point comes from: one platform connects a business to 1,000+ carriers across 190+ countries and 70+ pickup and drop-off networks, more than 1.2 million locations, so a locker option for a new market is a configuration change rather than a new integration.
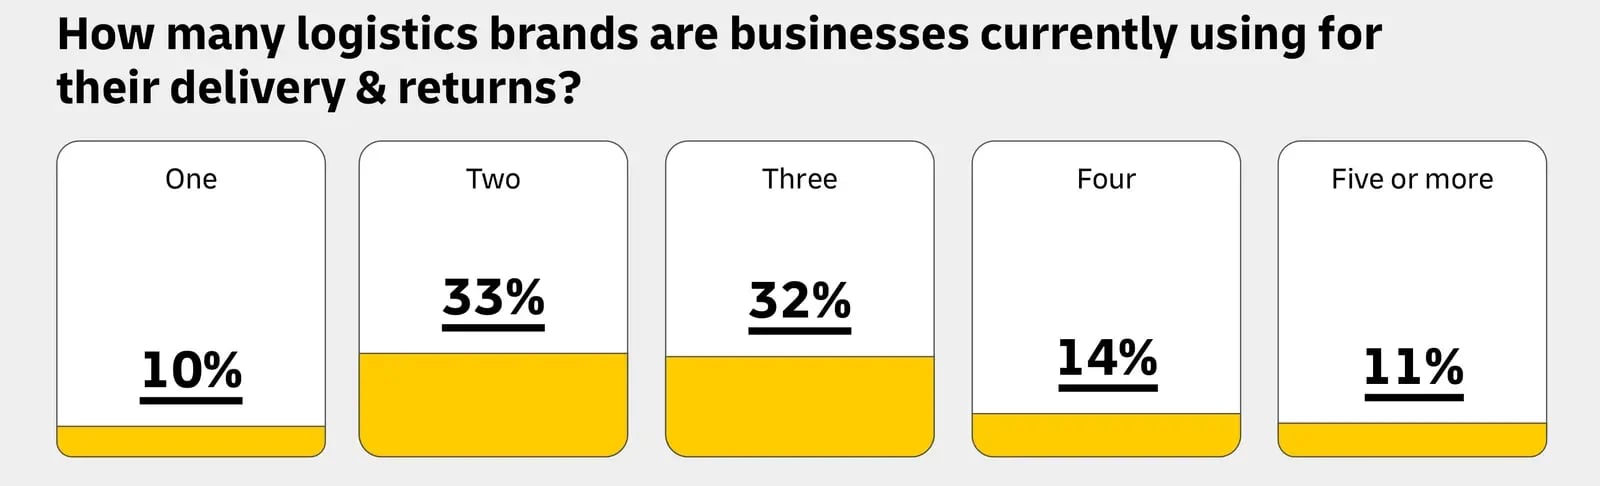
How many logistics brands businesses use for delivery and returns. Source: DHL eCommerce, 2026 E-Commerce Trends Report, chapter 8, page 34.
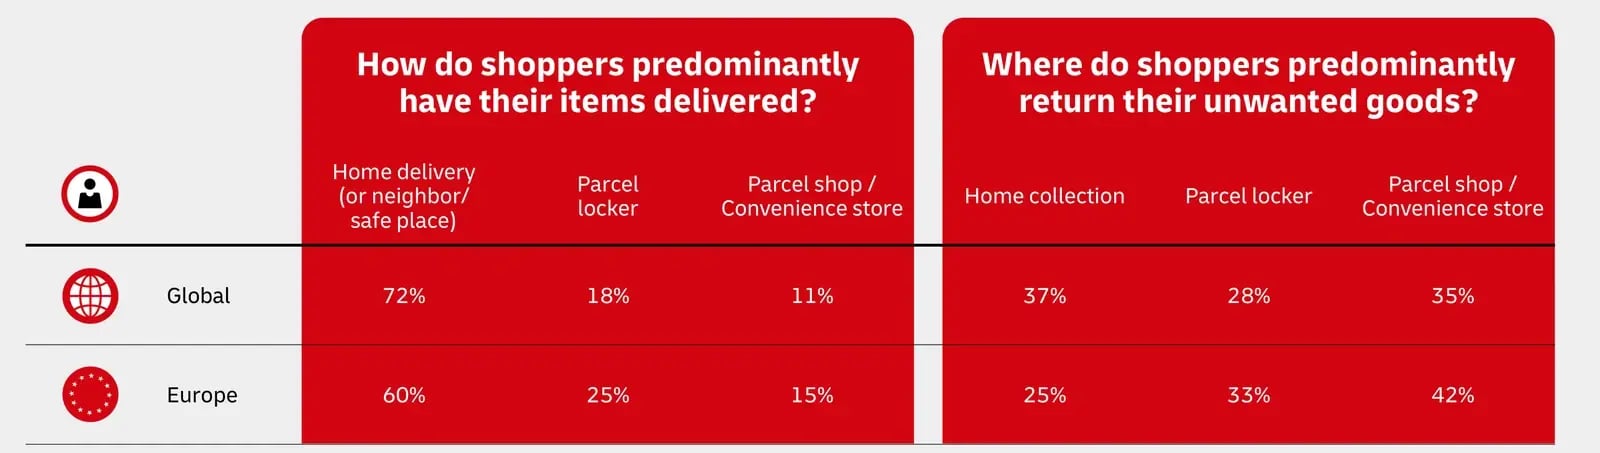
Delivery and returns locations, global versus Europe. Source: DHL eCommerce, 2026 E-Commerce Trends Report, chapter 8, page 35.
Cross-border demand grew faster than the operation behind it
The cleanest year-on-year movement in the report is cross-border buying. DHL says 70% of shoppers now buy internationally, up from 60% in 2025, and 45% do so more than once a month. On the business side, 61% sell across borders and more than three in ten orders are international. The 2025 Business Edit had 64% selling abroad, while localization of language and currency sits at almost the same level in both editions. With different business samples, it would be wrong to call that a decline. The fair reading is that shopper demand moved ten points while the business picture looks broadly steady.
60% to 70%
Shoppers who buy internationally, 2025 to 2026
The one year-on-year change DHL states directly in its 2026 E-Commerce Trends Report. 45% of shoppers now buy across borders more than once a month.
For European shoppers, cross-border often means next door: 77% of Austrian shoppers buy from Germany, 72% of Swiss shoppers do the same, and 63% of Portuguese shoppers buy from Spain. That proximity raises the bar. Someone buying from the country next door is unlikely to lower their expectations for pickup choice, transit time or returns. DHL's barriers reflect that: among shoppers who do not buy internationally, 45% cite delivery cost or time, 41% customs, duties or taxes, 36% complicated or costly returns and 33% uncertainty about the delivery provider. Businesses that stay domestic name much the same obstacles.
What would encourage shoppers to buy internationally is also remarkably stable across the two editions: free delivery, secure payment, free returns, prices in local currency and clear transit times all remain near the top. For a delivery team, that translates into fairly concrete work: transit promises a carrier can keep, prices that account for duties, a familiar return route and customs data that clears the parcel.
The storefront is usually the easy part to localize. Delivery catches up market by market, with a different carrier mix, pickup network, transit promise, free-shipping threshold, returns method and customs setup. Maya Delorez, a Swedish equestrian brand, covers around 80 markets with an automated shipping workflow, while Rebelz generates customs documents, labels and return labels automatically for its 54 countries. The webshop does not need rebuilding every time the delivery setup changes. Our guide to the post-checkout experience in cross-border ecommerce goes through that work market by market.
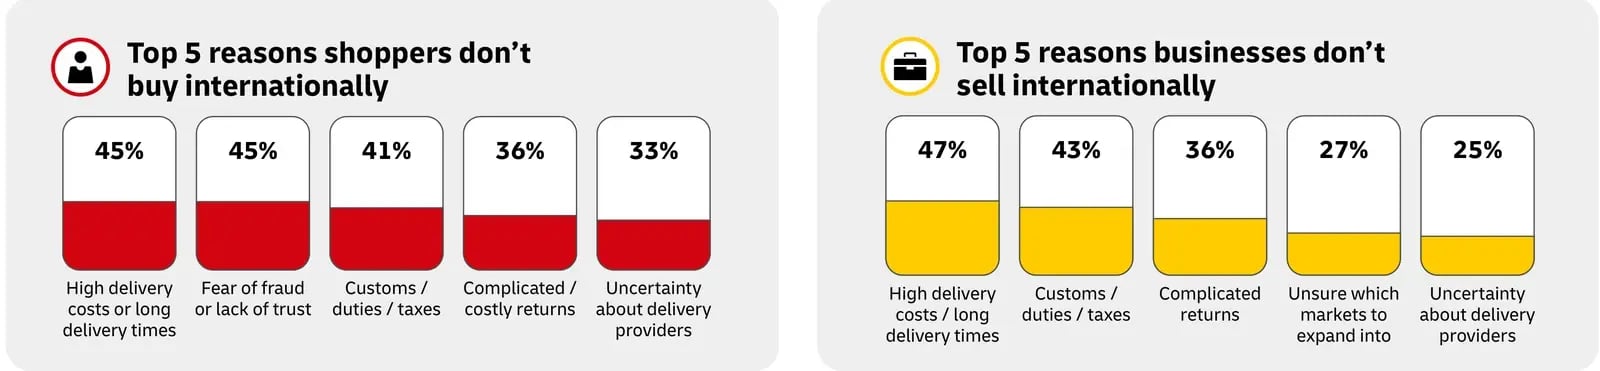
Why shoppers do not buy, and businesses do not sell, across borders. Source: DHL eCommerce, 2026 E-Commerce Trends Report, chapter 2, page 13.
The reasons shoppers give for returns belong outside the returns desk
Shoppers and businesses explain returns very differently. In DHL's 2026 data, shoppers point first to products that were faulty, poor quality or not as expected (60%) and to sizing (46%). Businesses are more likely to cite customers changing their mind (40%), goods lost or damaged in transit (42%), customs delays or charges (29%) and shoppers ordering extra to reach free delivery and sending the rest back (27%). On the shopper side, those last three reasons score 19%, 15% and 12%.
A similar pattern appeared in 2025, when shoppers led with poor quality, wrong size and transit damage, while businesses led with transit damage, the item no longer being wanted and customers ordering more than one. The samples and questions have changed, but the direction has not. Shoppers tend to explain returns through the product they received; businesses are more likely to explain them through the process or customer behavior around it.
Quality and expectation returns belong in product content and supplier conversations. Sizing belongs with fit information. Transit damage, which both sides put near 40%, belongs with packaging and carrier performance. If customers are padding baskets to reach free delivery and sending the surplus back, the free-shipping threshold deserves scrutiny too. Processing the return is only the immediate job; the reason needs to reach the team that can prevent the next one.
nShift Returns analytics scores products by return rate and return count and surfaces the ten that need attention first. From there, the team can see whether it is looking at a quality issue, weak product content or something that needs taking back to a supplier. Our returns management trends piece looks at where the returns operation goes next.
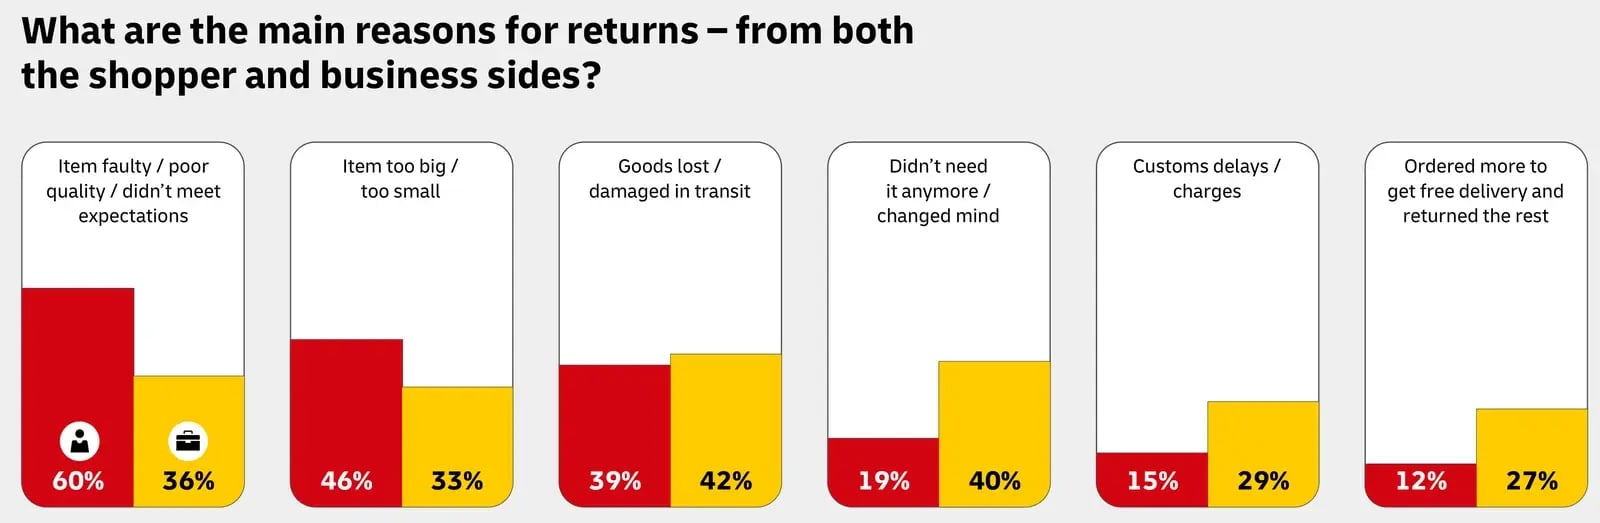
Main reasons for returns, shopper side and business side. Source: DHL eCommerce, 2026 E-Commerce Trends Report, chapter 8, page 36.
Sustainability: shoppers will switch to a pickup point before they will pay more
Thirty-one percent of shoppers would restrict purchases to retailers using sustainable delivery, 20% would accept longer delivery or return times, another 20% would use collection or drop-off points, and just 10% would pay more. Elsewhere, 35% say they have abandoned a purchase over missing sustainability credentials, while 42% of businesses expect green logistics to become standard within five years.
Twenty-three percent of shoppers already prefer pickup points for sustainability reasons. But a service labeled green does not tell a business what a shipment actually emitted. Comparing a locker service with home delivery, or one carrier with another, needs shipment-level data calculated on a recognized methodology. Emissions Tracker does that, with Smart Freight Centre certification against ISO 14083 and the Global Logistics Emissions Council (GLEC) Framework.
AI shopping needs delivery data it can read
Nearly one in three shoppers already use AI-powered chat tools every time they shop or often, and 38% have used them to browse or buy. Looking ahead, 29% would let AI make shopping decisions or purchases for them within five years, though only 18% in Europe. On the business side, 67% use some form of AI across their ecommerce platforms, up from 53% in the 2025 Business Edit, and 70% expect their use of AI to increase over the next five years. DHL's closing advice is that AI adoption depends on trust: shoppers will use it where it is useful and accurate.
Delivery has its own version of that trust problem. Shoppers and businesses worry first about privacy and security, then about AI misreading a query or returning irrelevant results. One in five businesses also lists incorrect delivery and returns optimization as a concern. An assistant asked whether an order can arrive by Friday, whether it can go to a nearby locker, what each option costs or how a return works from that address needs current delivery data to answer properly: checkout configuration, carrier services for the postcode, shipment events and returns rules.
We made a related point in our mid-year review of the 2026 predictions: delivery options that a machine cannot parse risk dropping out of consideration. DHL's adoption figures make that less hypothetical. Businesses planning to use more AI will need a readable delivery record: which options exist for which addresses, at what price and with what promise, followed by what actually happened to the shipment. That work happens in the delivery operation before an AI model ever sees the data. The practical test is whether every delivery option a business offers exists as data a system can query, with its price, promise and coverage attached. Our piece on AI shopping agents and the delivery promise looks at the point where the agent, rather than the shopper, starts reading the checkout.
What to take into 2027 planning
DHL's 2026 report points to a delivery operation that is increasingly multi-carrier, market-specific and expected to change without disrupting the customer experience.
For 2027 planning, that leaves a fairly practical list:
-
Keep a record of the delivery offer by market. Know which options appeared, which were chosen and where shoppers stalled at the shipping step. The DHL abandonment gap suggests businesses are missing some of that context.
-
Price the promise before the invoice arrives. Know which carrier and service will take a free-shipping or next-day order, what you expect it to cost, and whether the invoice agrees.
-
Localize delivery when you localize the storefront. Carrier mix, pickup network, transit promise, returns route and customs data all need a market-level answer.
-
Send return reasons to the teams that can act on them. Product content, sizing, packaging, carrier management and even the free-shipping threshold may be involved.
-
Make the delivery record readable by software. If AI is moving into the purchase path, delivery options and rules cannot live in places an assistant cannot interpret.
DHL's own closing note in the report makes the same point from the shopper's side.
"For businesses, that creates both pressure and opportunity. Those who can meet the consumers' needs going forward and bridge that expectation gap, will be best positioned for growth."
Pablo Ciano, CEO, DHL eCommerce, in the 2026 E-Commerce Trends Report
Our mid-year check-in goes further into where these trends are heading. The nShift platform brings delivery choice, carrier execution, tracking and returns together. DHL's report is a good prompt to check whether the operation behind your checkout can actually see and adapt to the choices customers are making.
See where these trends are heading.
Our 2026 trends mid-year check-in grades ten January predictions against market, regulatory and platform data, and names the developments that caught the industry off guard.
Get the report